Scraping By...
in Tennis on Tennis, Atp, Analytics

A quick update to keep this blog fresh!
In the months since my manual data collection project, I spent most of my hobby-coding free time well, trying to collect even more. Not manually of course, as I realised that the ATP website started having the “Court Vision” stats pages for a good number of tournaments in 2022.
Since anything(?) on the internet can be scraped, there was an opportunity to collect a decent sample of tennis data to fuel more analytical explorations (much like Peter Tea did using the court vision data from Roland Garros 2021). Initially, I ran into encrypted source data, so I attempted a selenium-automation approach. Here’s how that went…
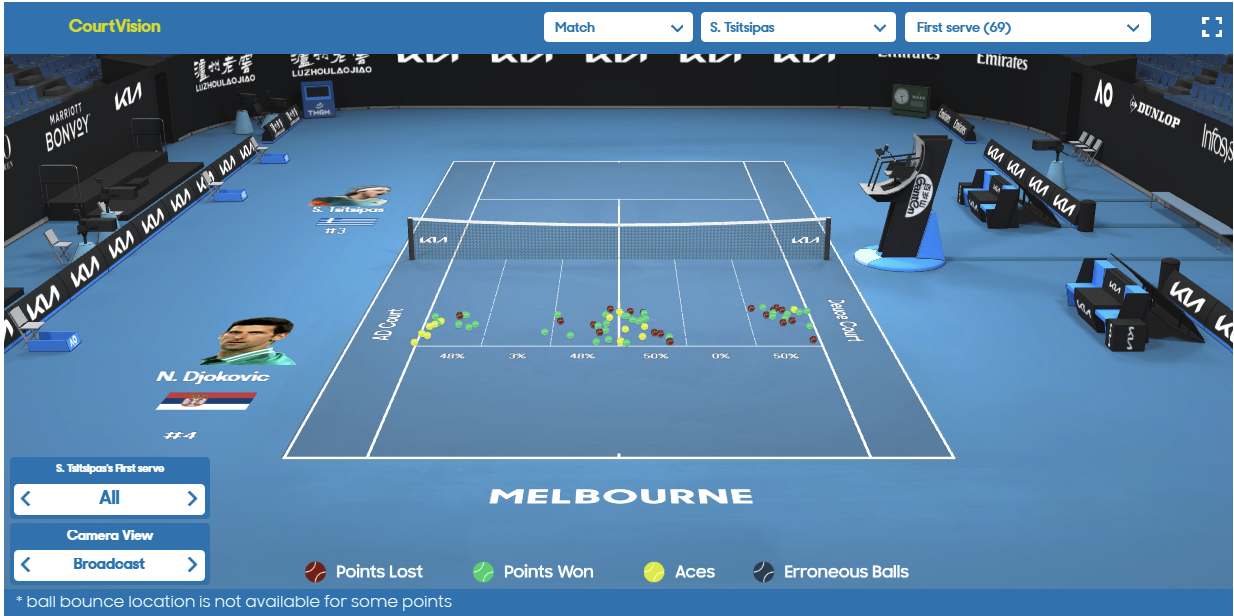
1. Scraper version 1 was actually pretty straightforward selenium; just locate all the ball elements and we’re good to go. The challenge here was extracting the court dimensions and knowing what data transformations were needed.
Charlie needs to spot better
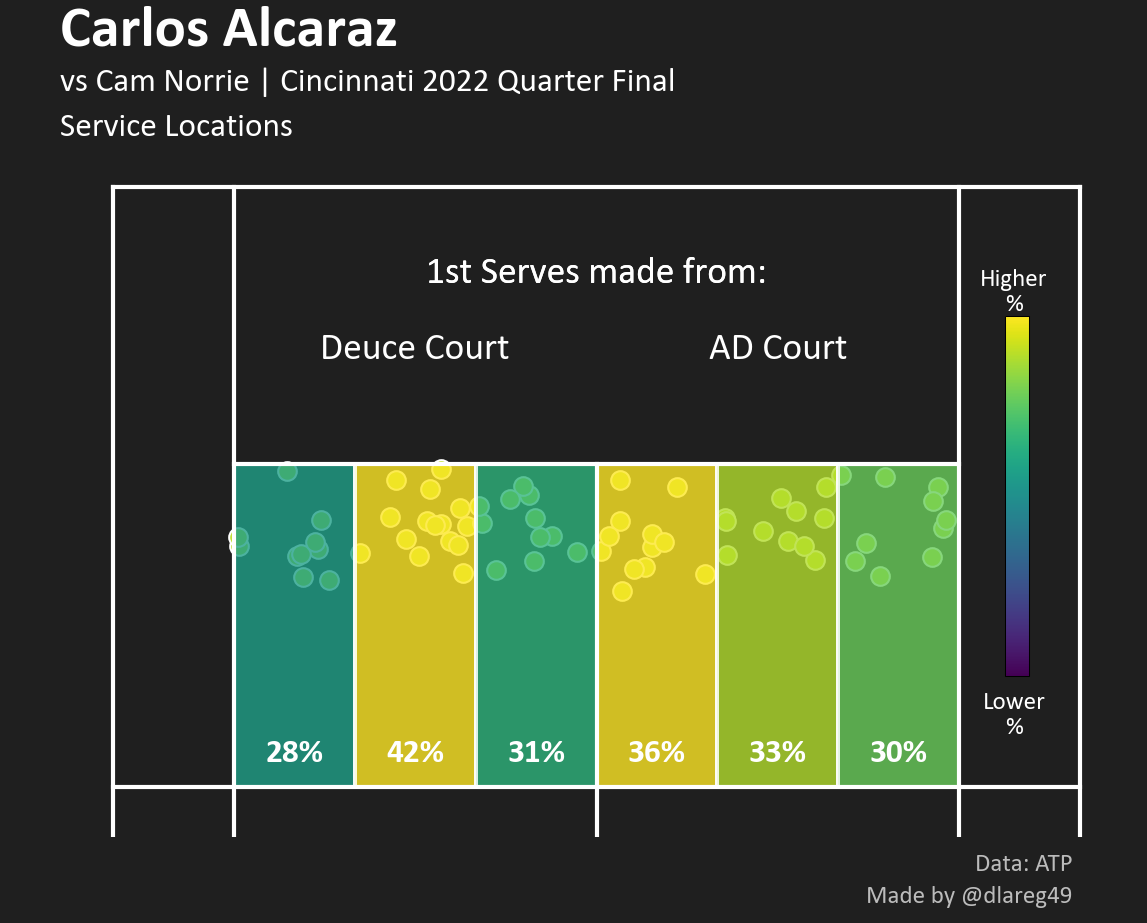
2. The above gave me just the serve bounce coordinates and of course that isn’t nearly enough. Ball speed, serve type, point context, etc… I had to revamp more or less all the automation to chronologically cycle through the match timeline and go ball-to-ball for information.
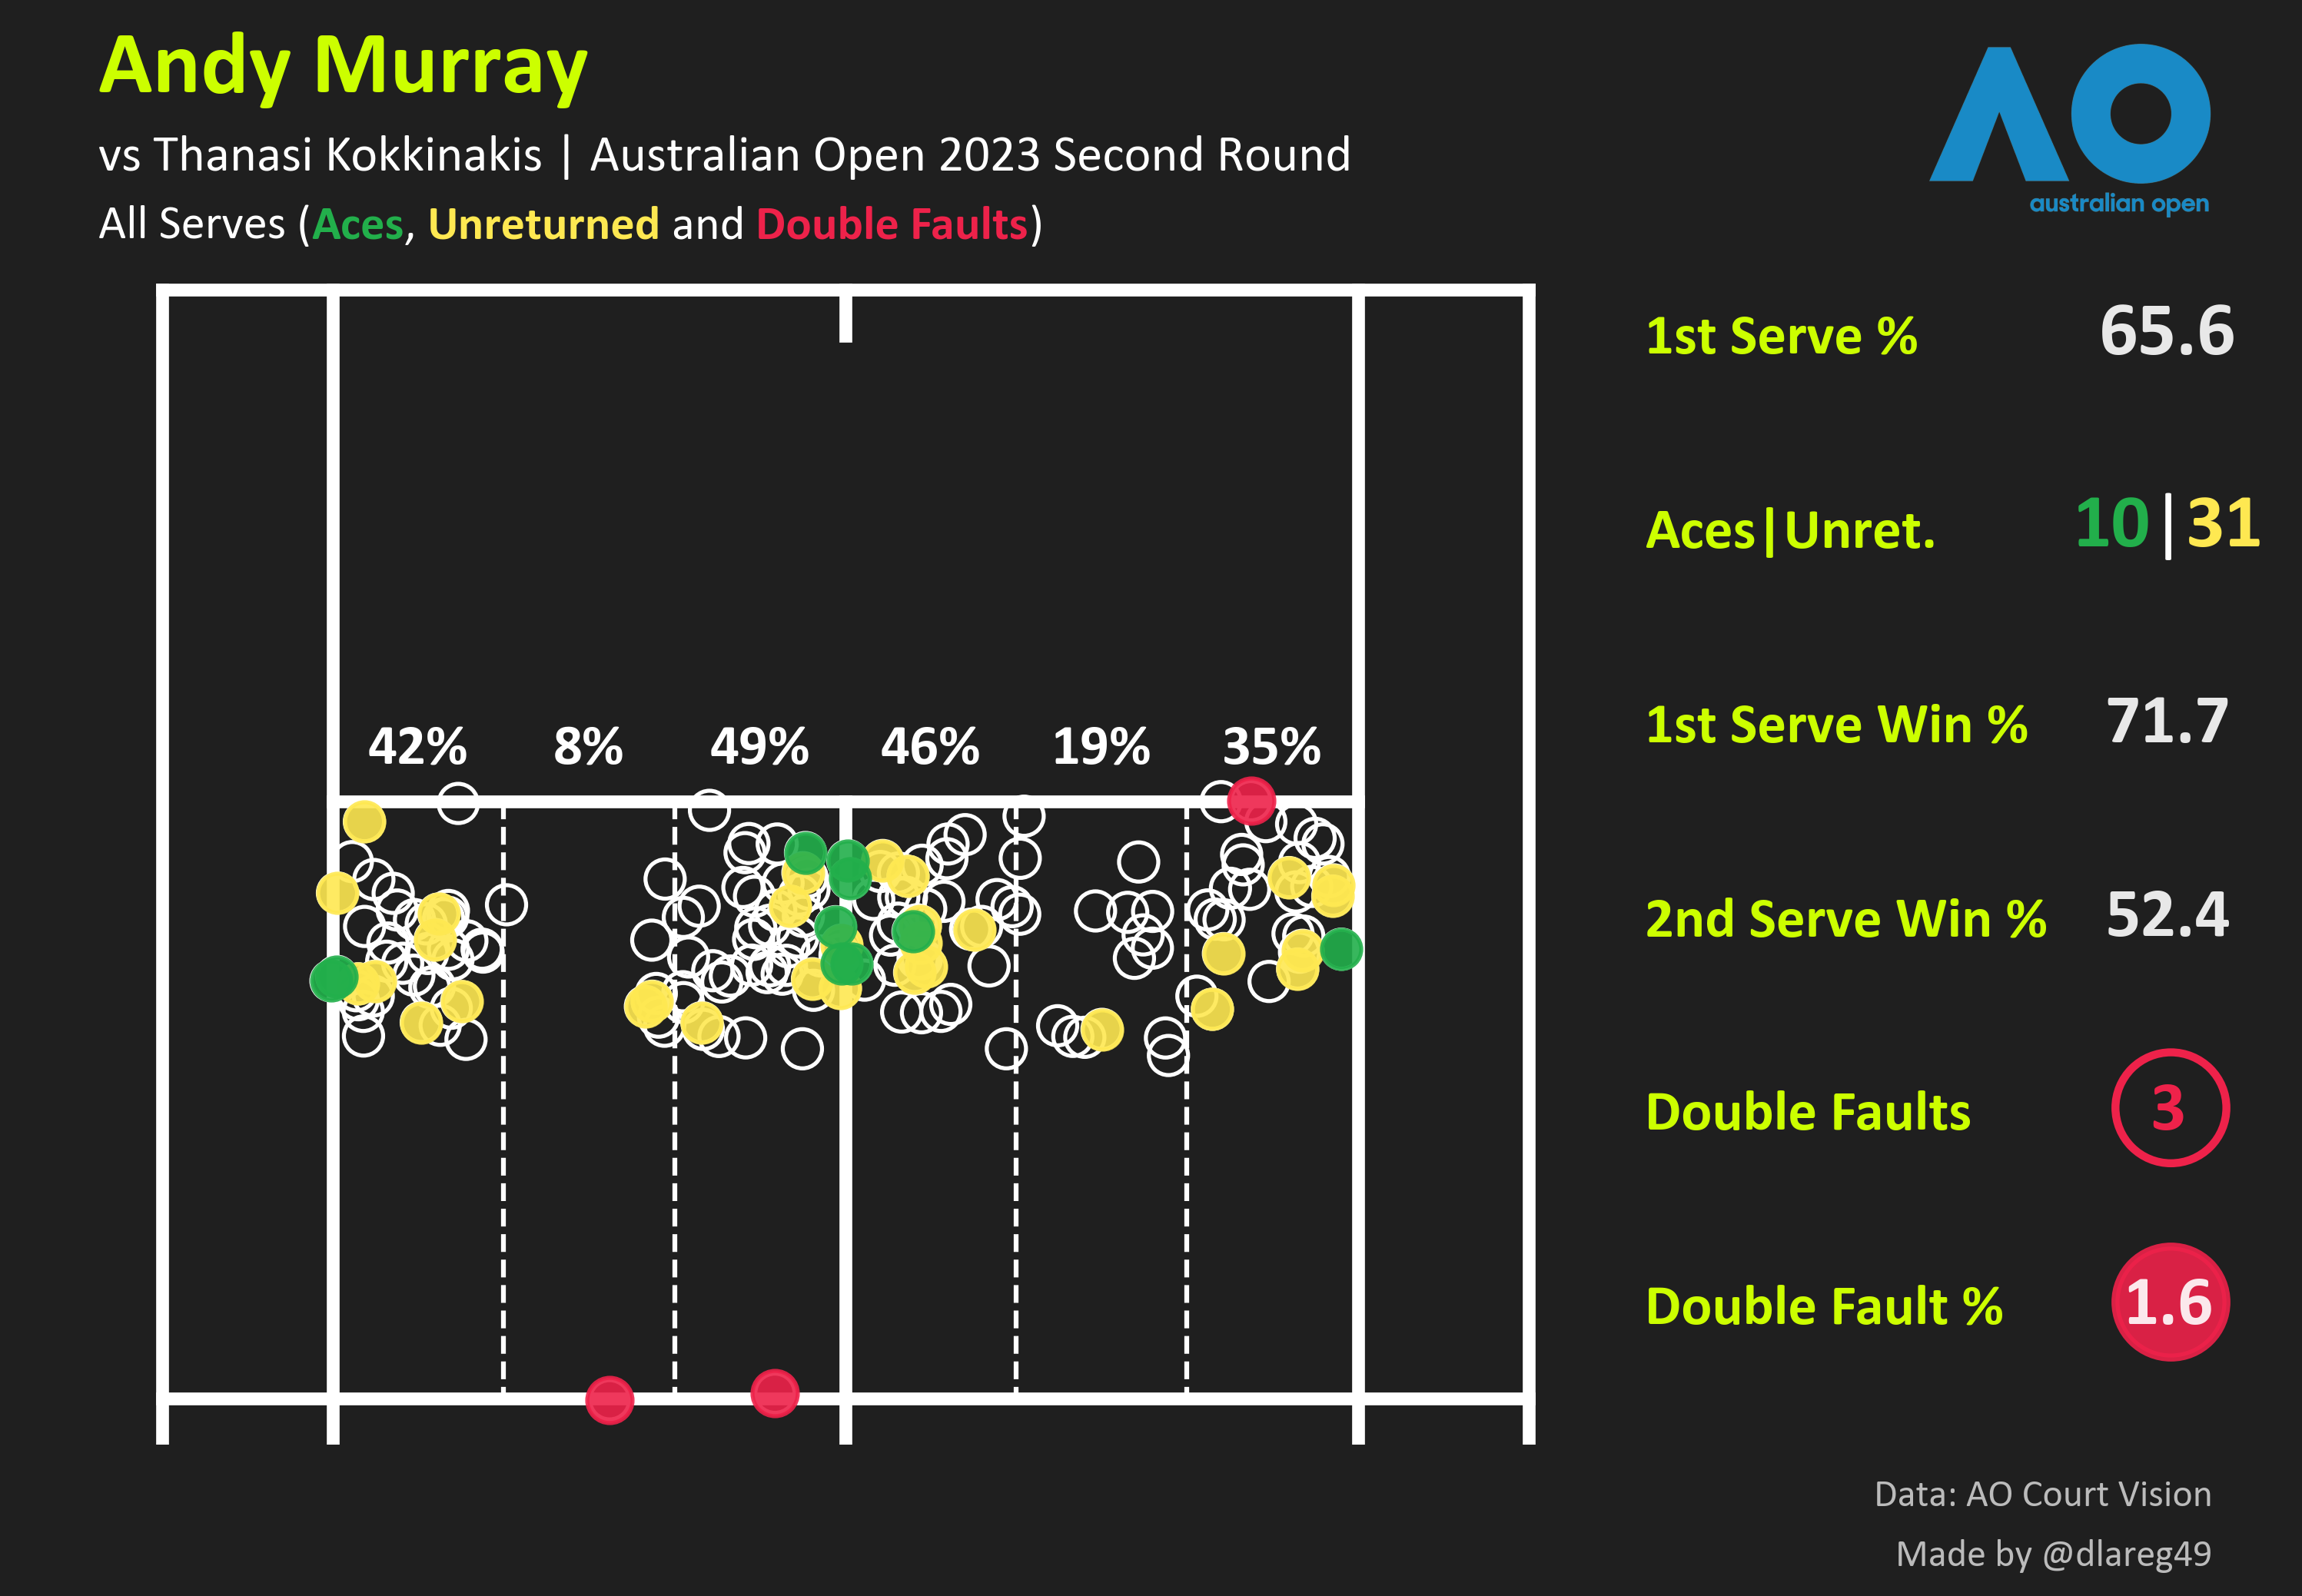
3. This code was working okay for single matches but was breaking down and also too inefficient for doing multi-match/tournament stuff. Around this time the Australian Open was starting too, so I began porting and modifying the script for the Open’s page. With the bits of data I managed to put together several dashboard-type vizzes, here’s one from Andy Murray’s 2nd round epic.
4. Just when I was about to bury this endeavour for good, I chanced upon this page. Some ChatGPT and code tweaks later…my old code was ready for the bin. Stackoverflow user Gabjauf, a true open data hero. With considerable help from Peter’s older work to label things, it was time to have some fun. A couple of example visuals here:
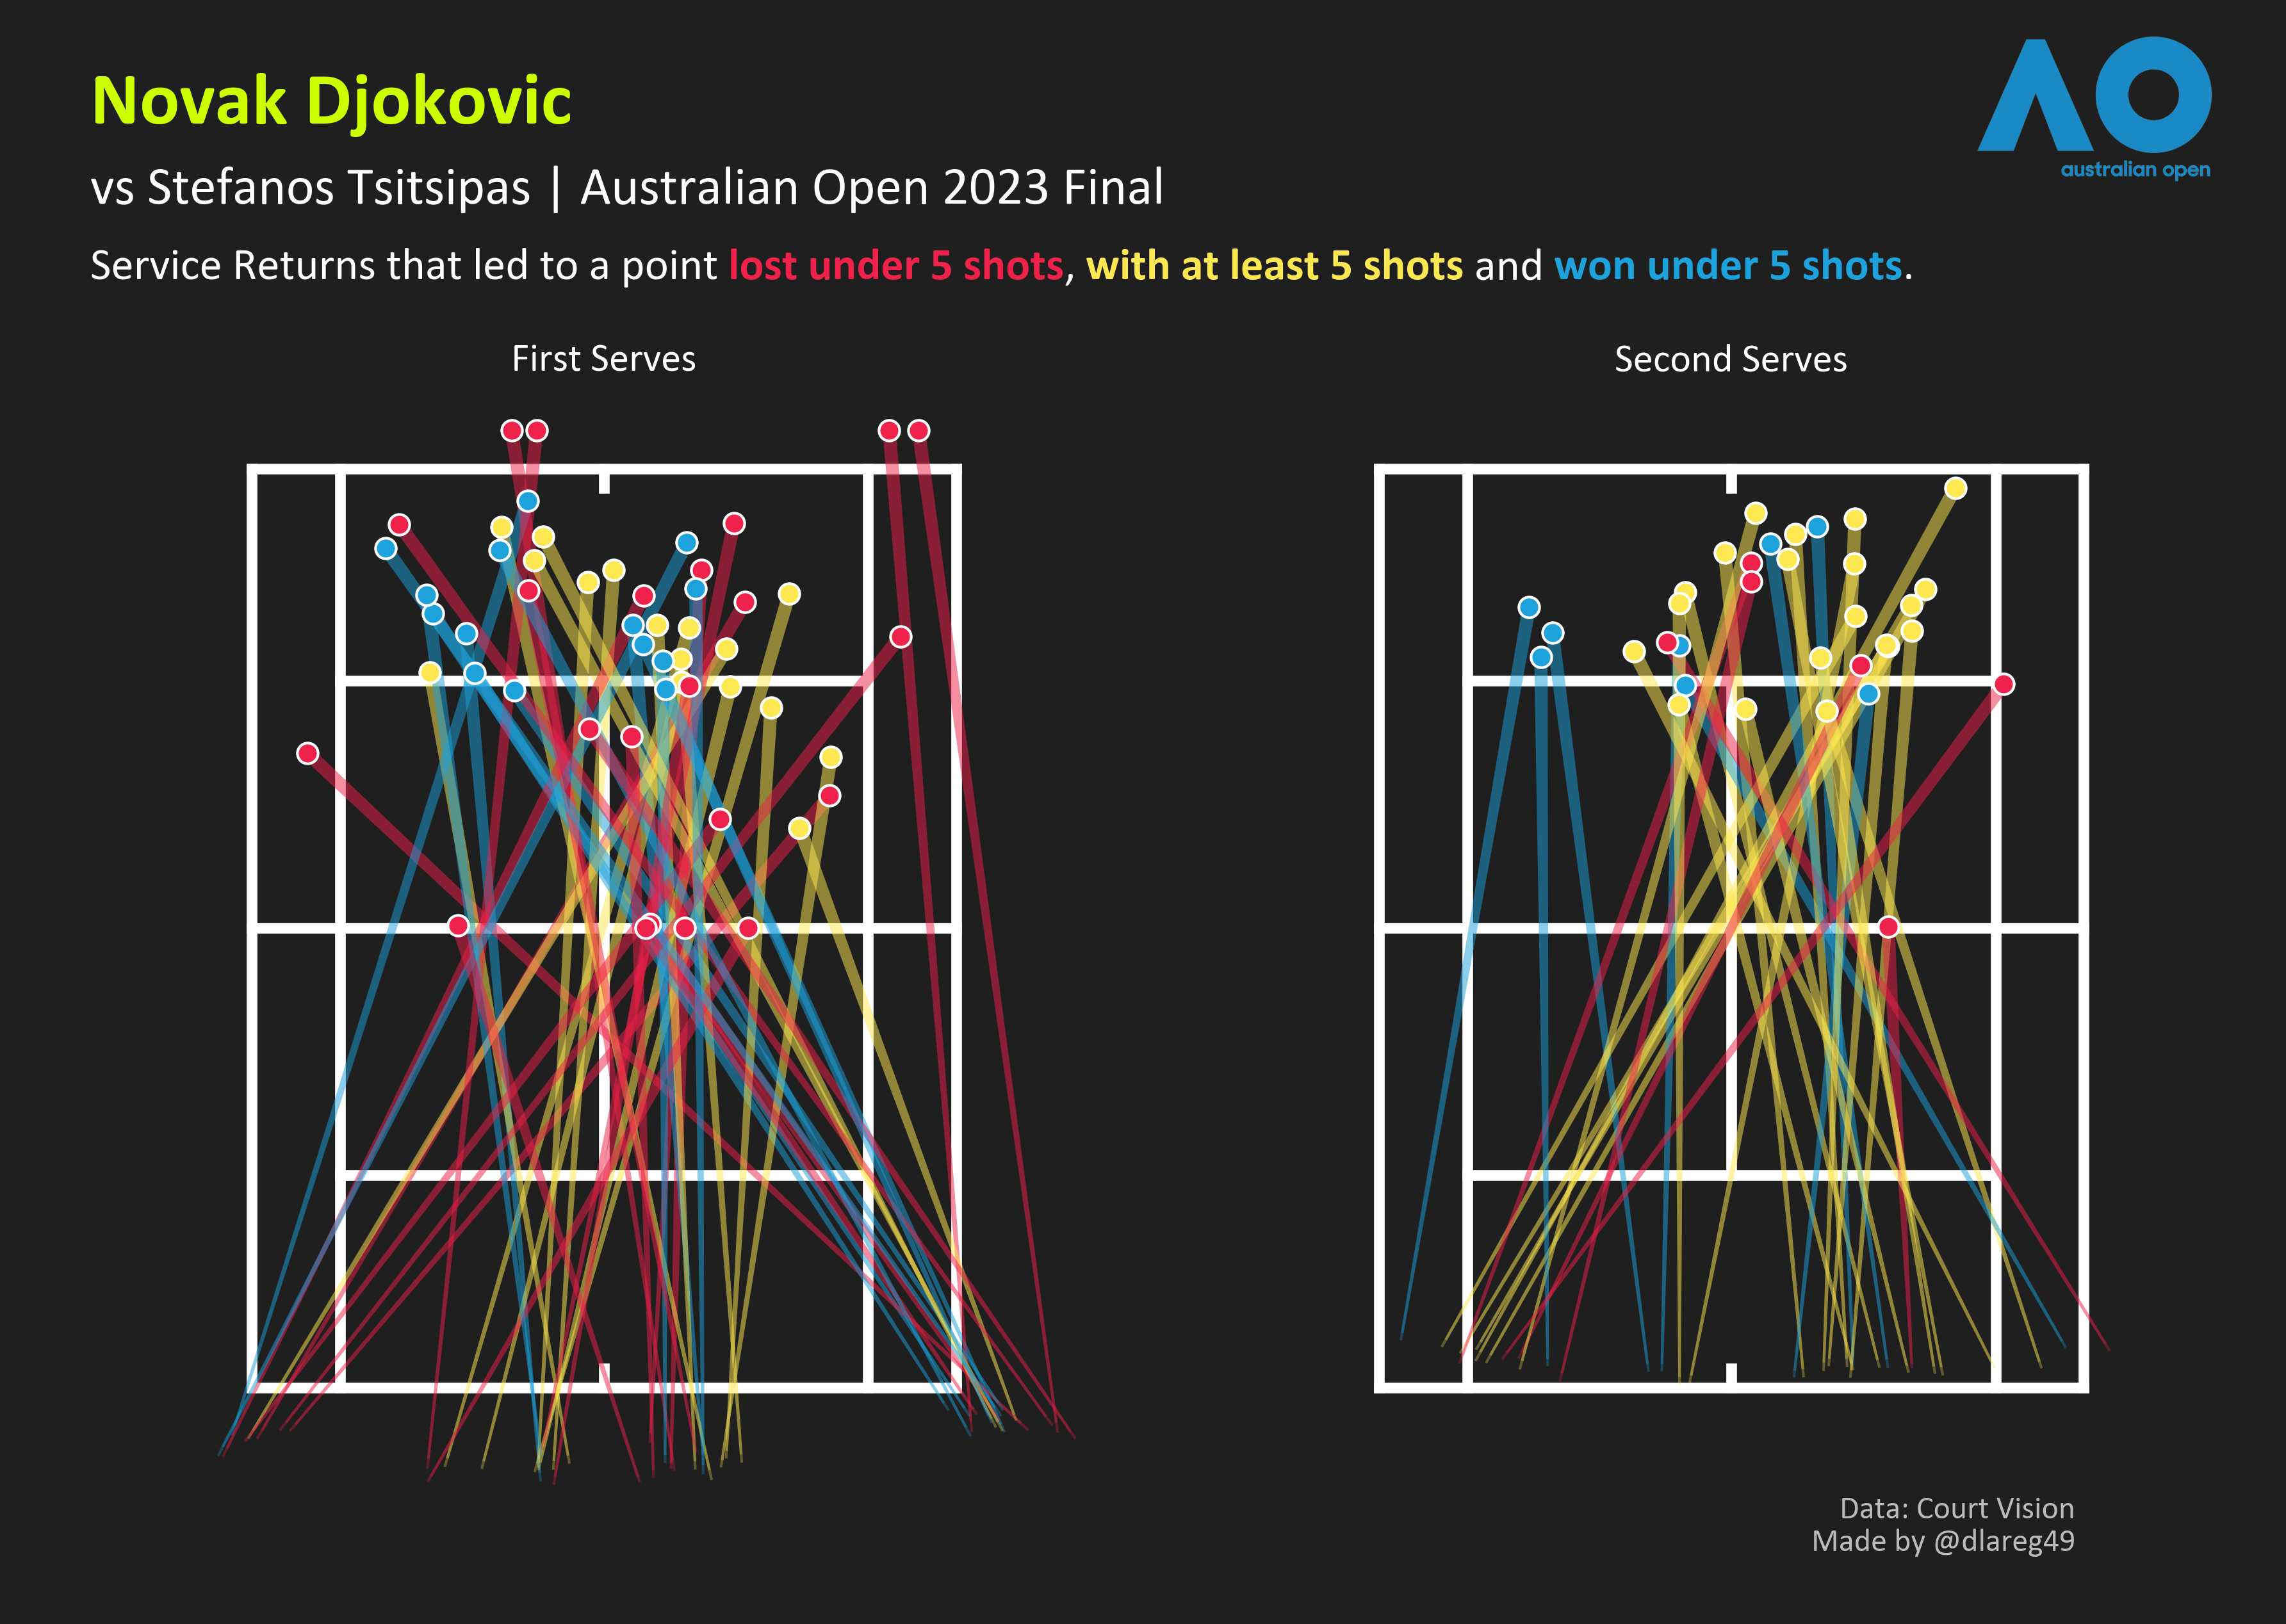
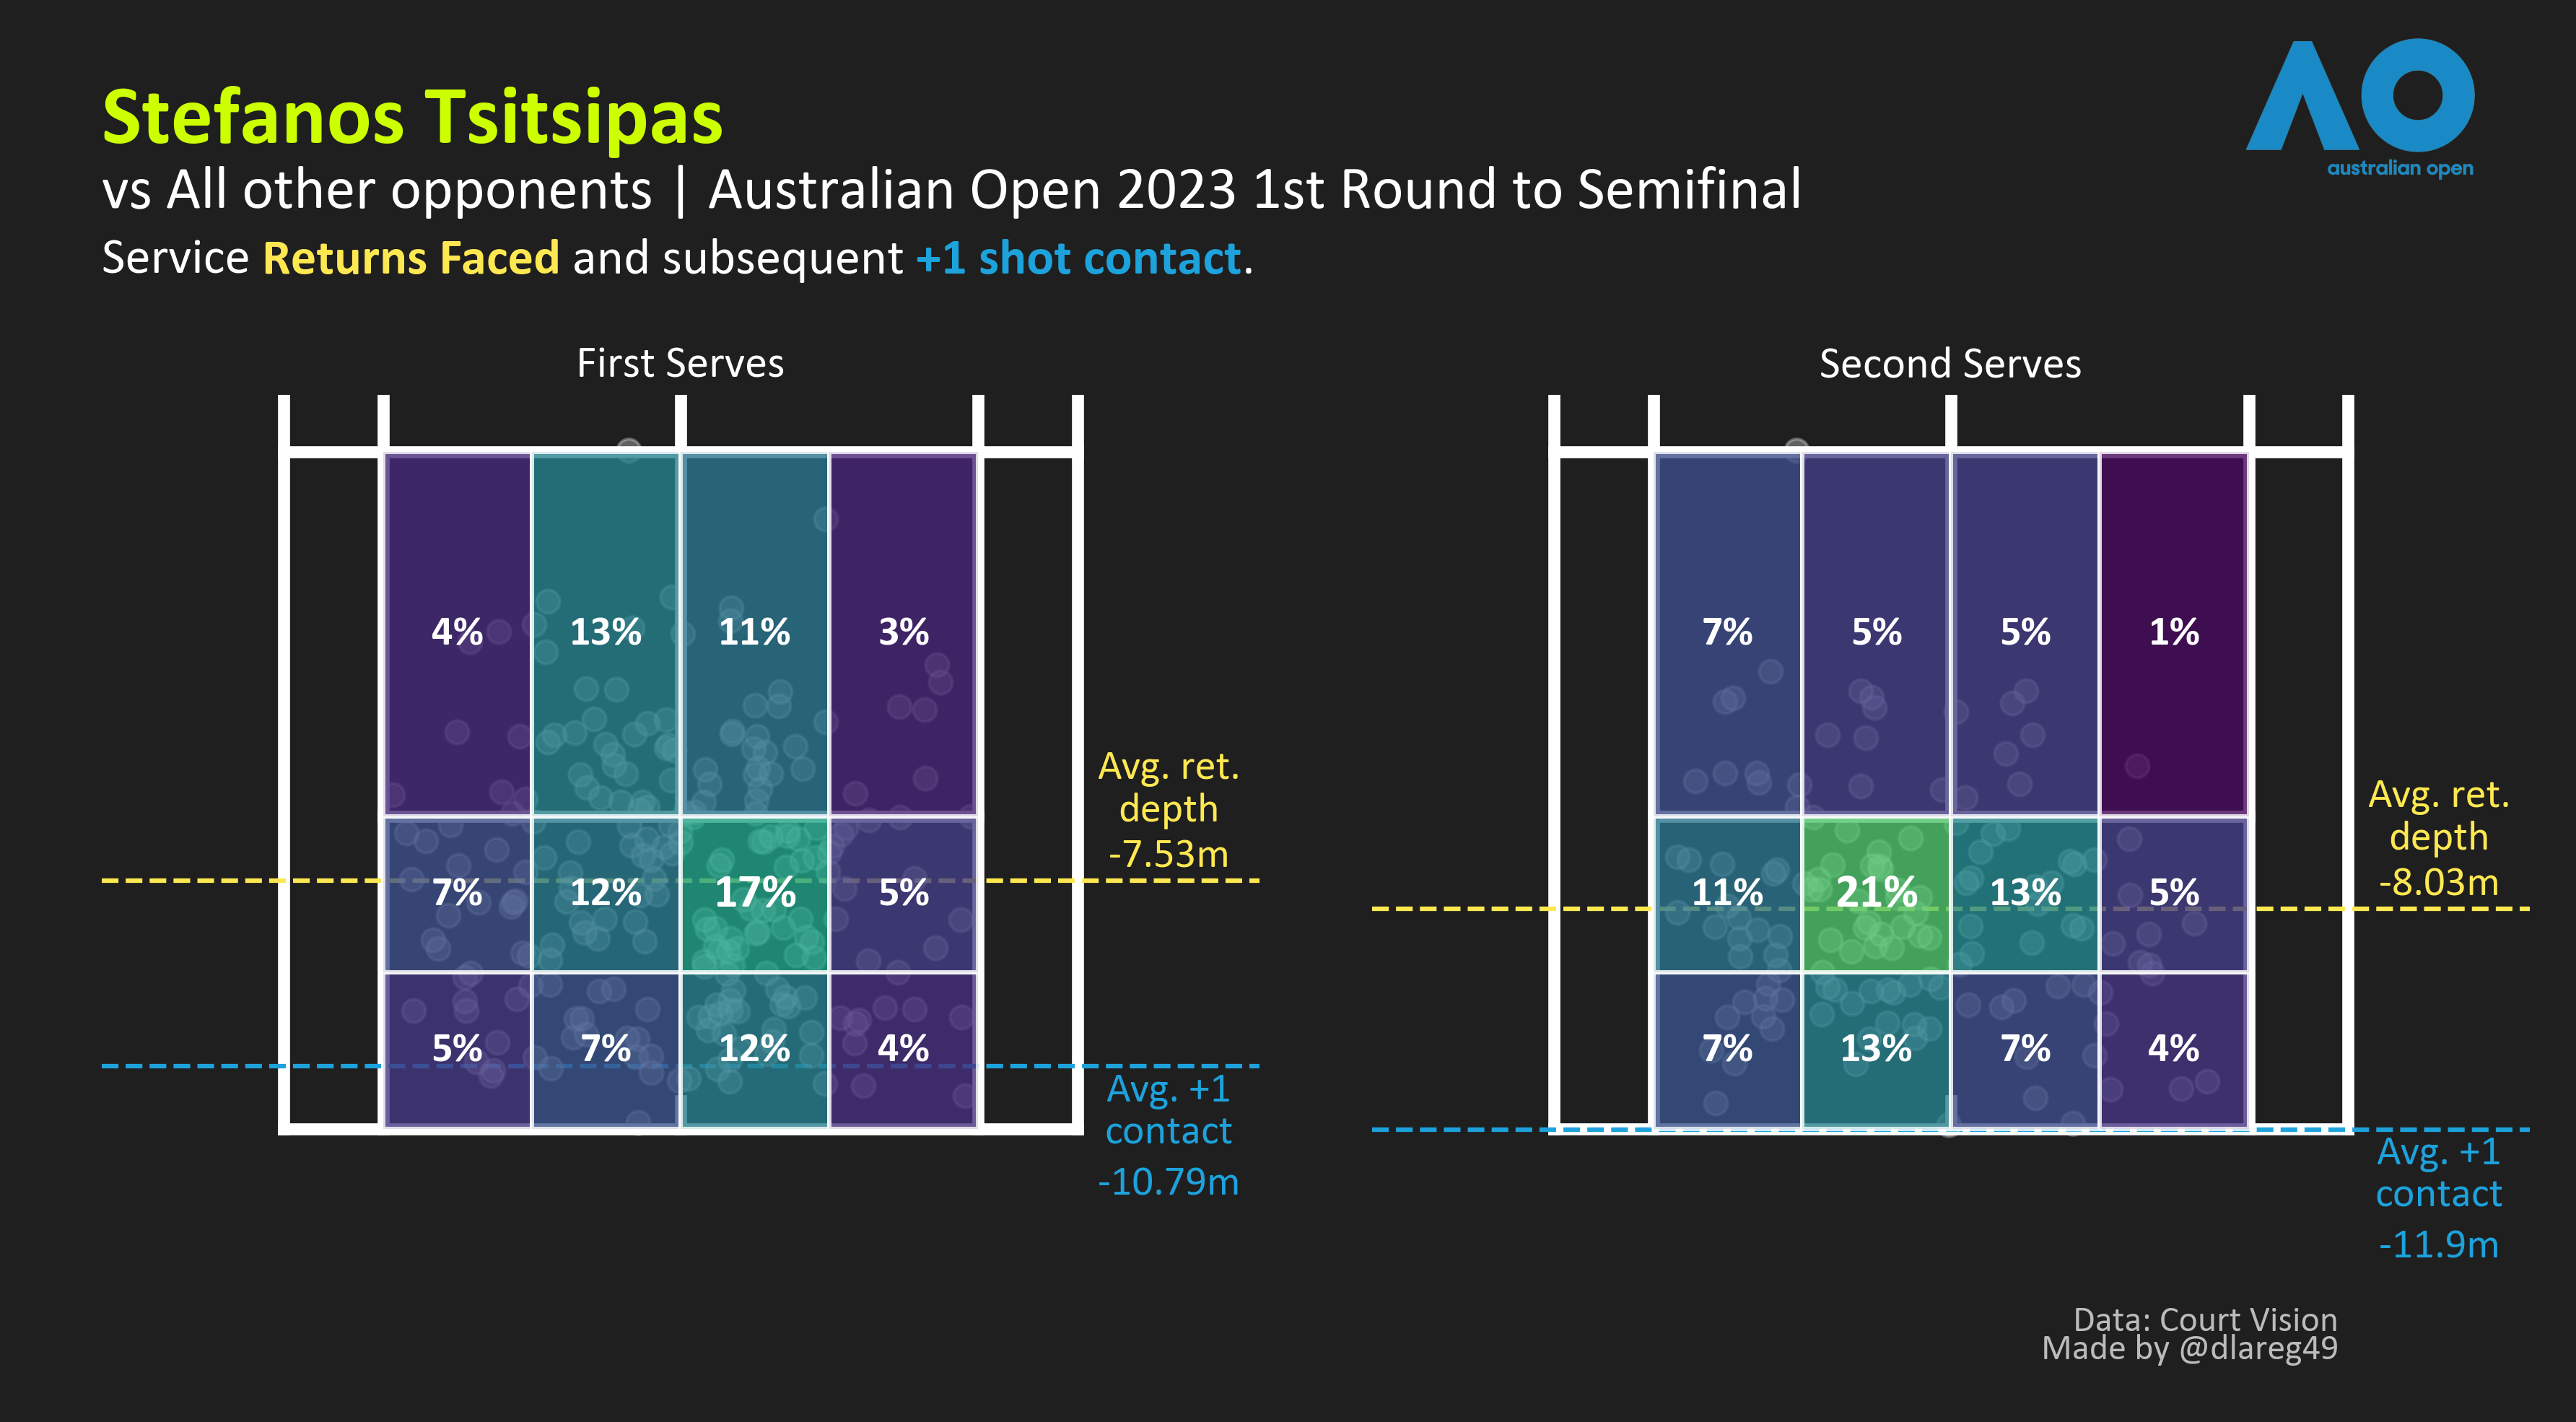
Stefanos vs others: meh
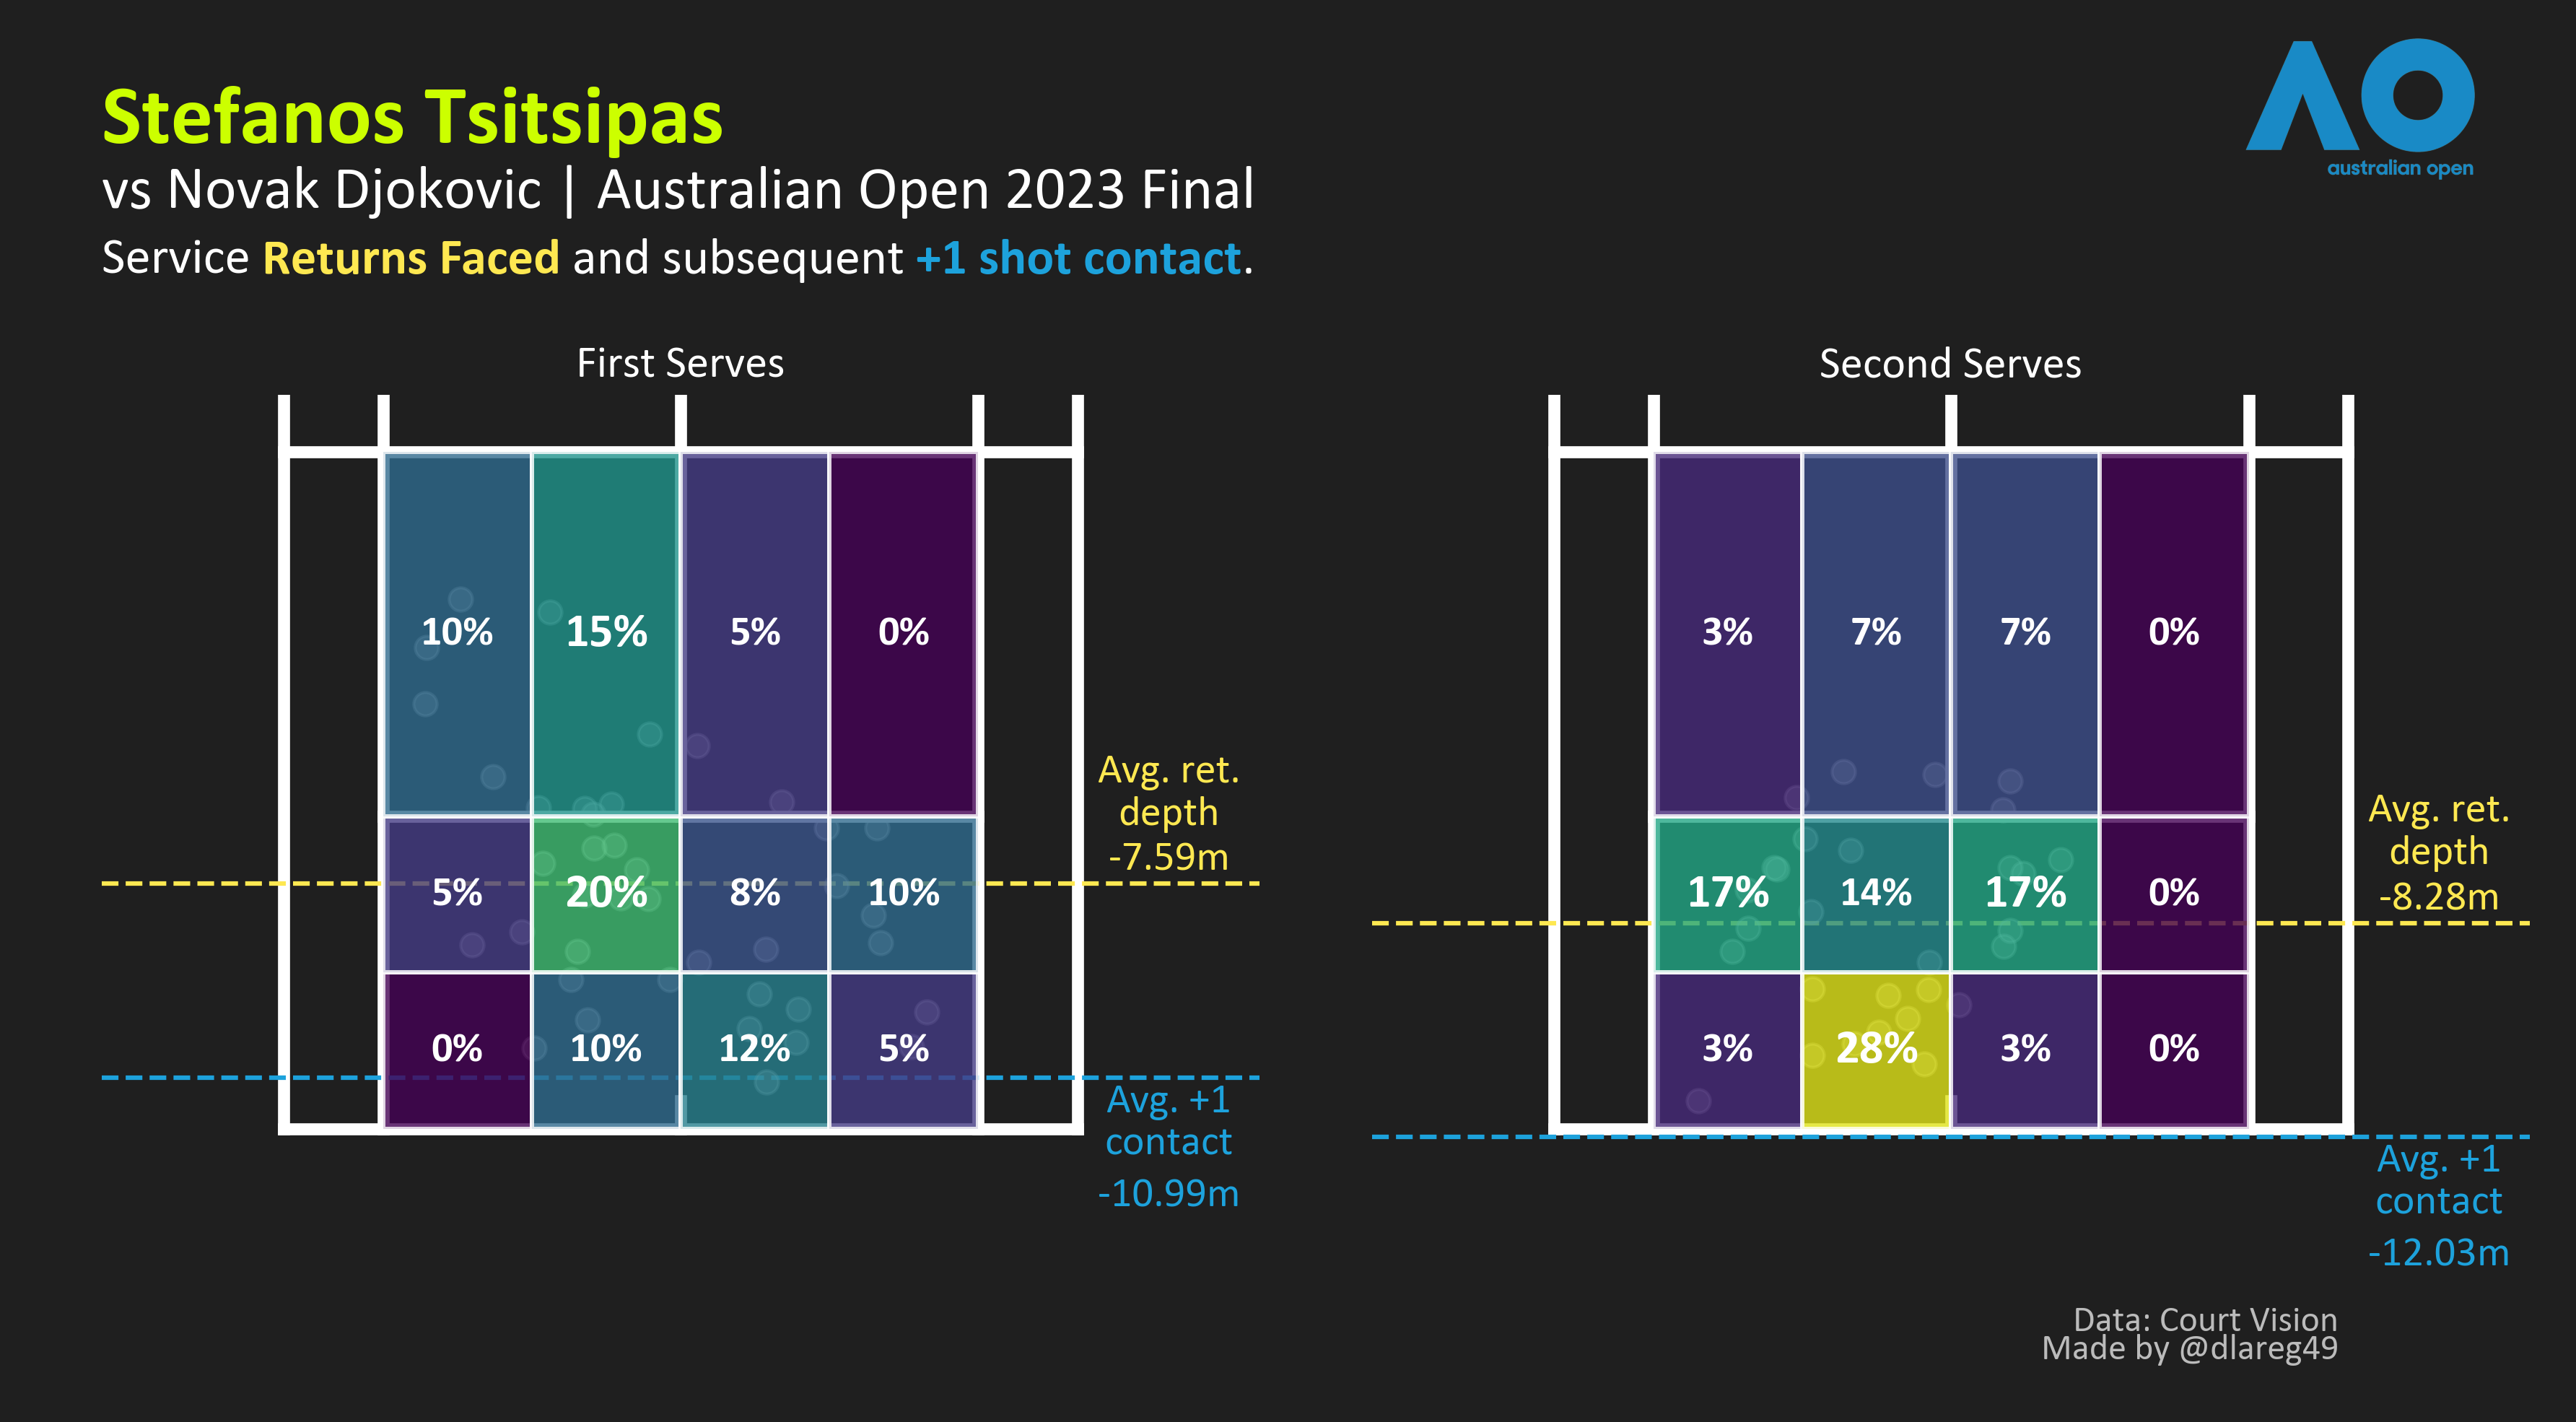
vs Novak: I’m in danger
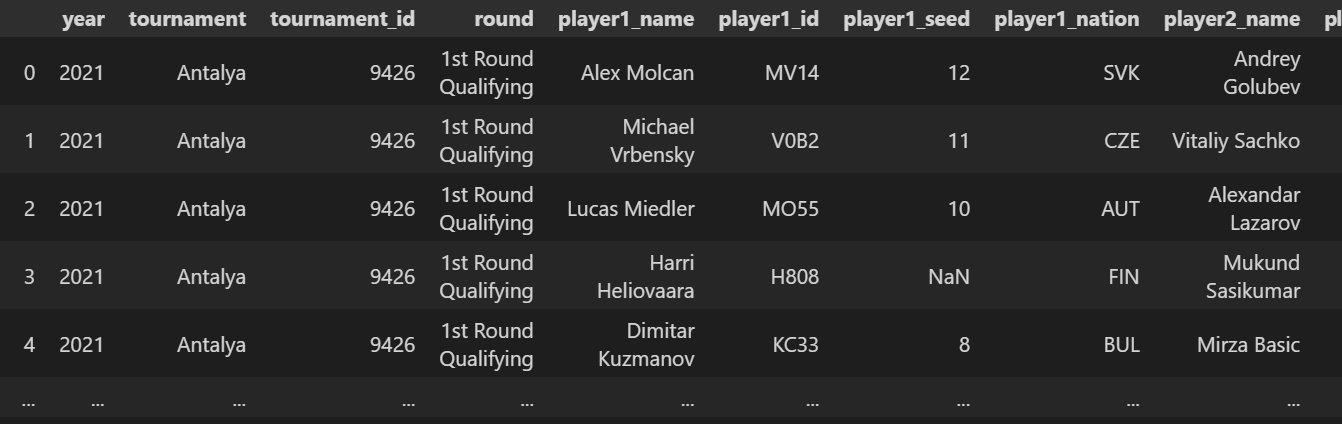
5. To be fair to myself, my original codes weren’t entirely binned, as I still use parts of it now to crawl the ATP’s website for the calendar, tournament results and match page URLs to create tables like this:
What next?
I’m currently experimenting with models to measure serve and return quality based on ball speed, direction, placement + other possible features from the dataset. Here’s a “serve quality” visual I made using predictions from a basic 2-feature regression model:
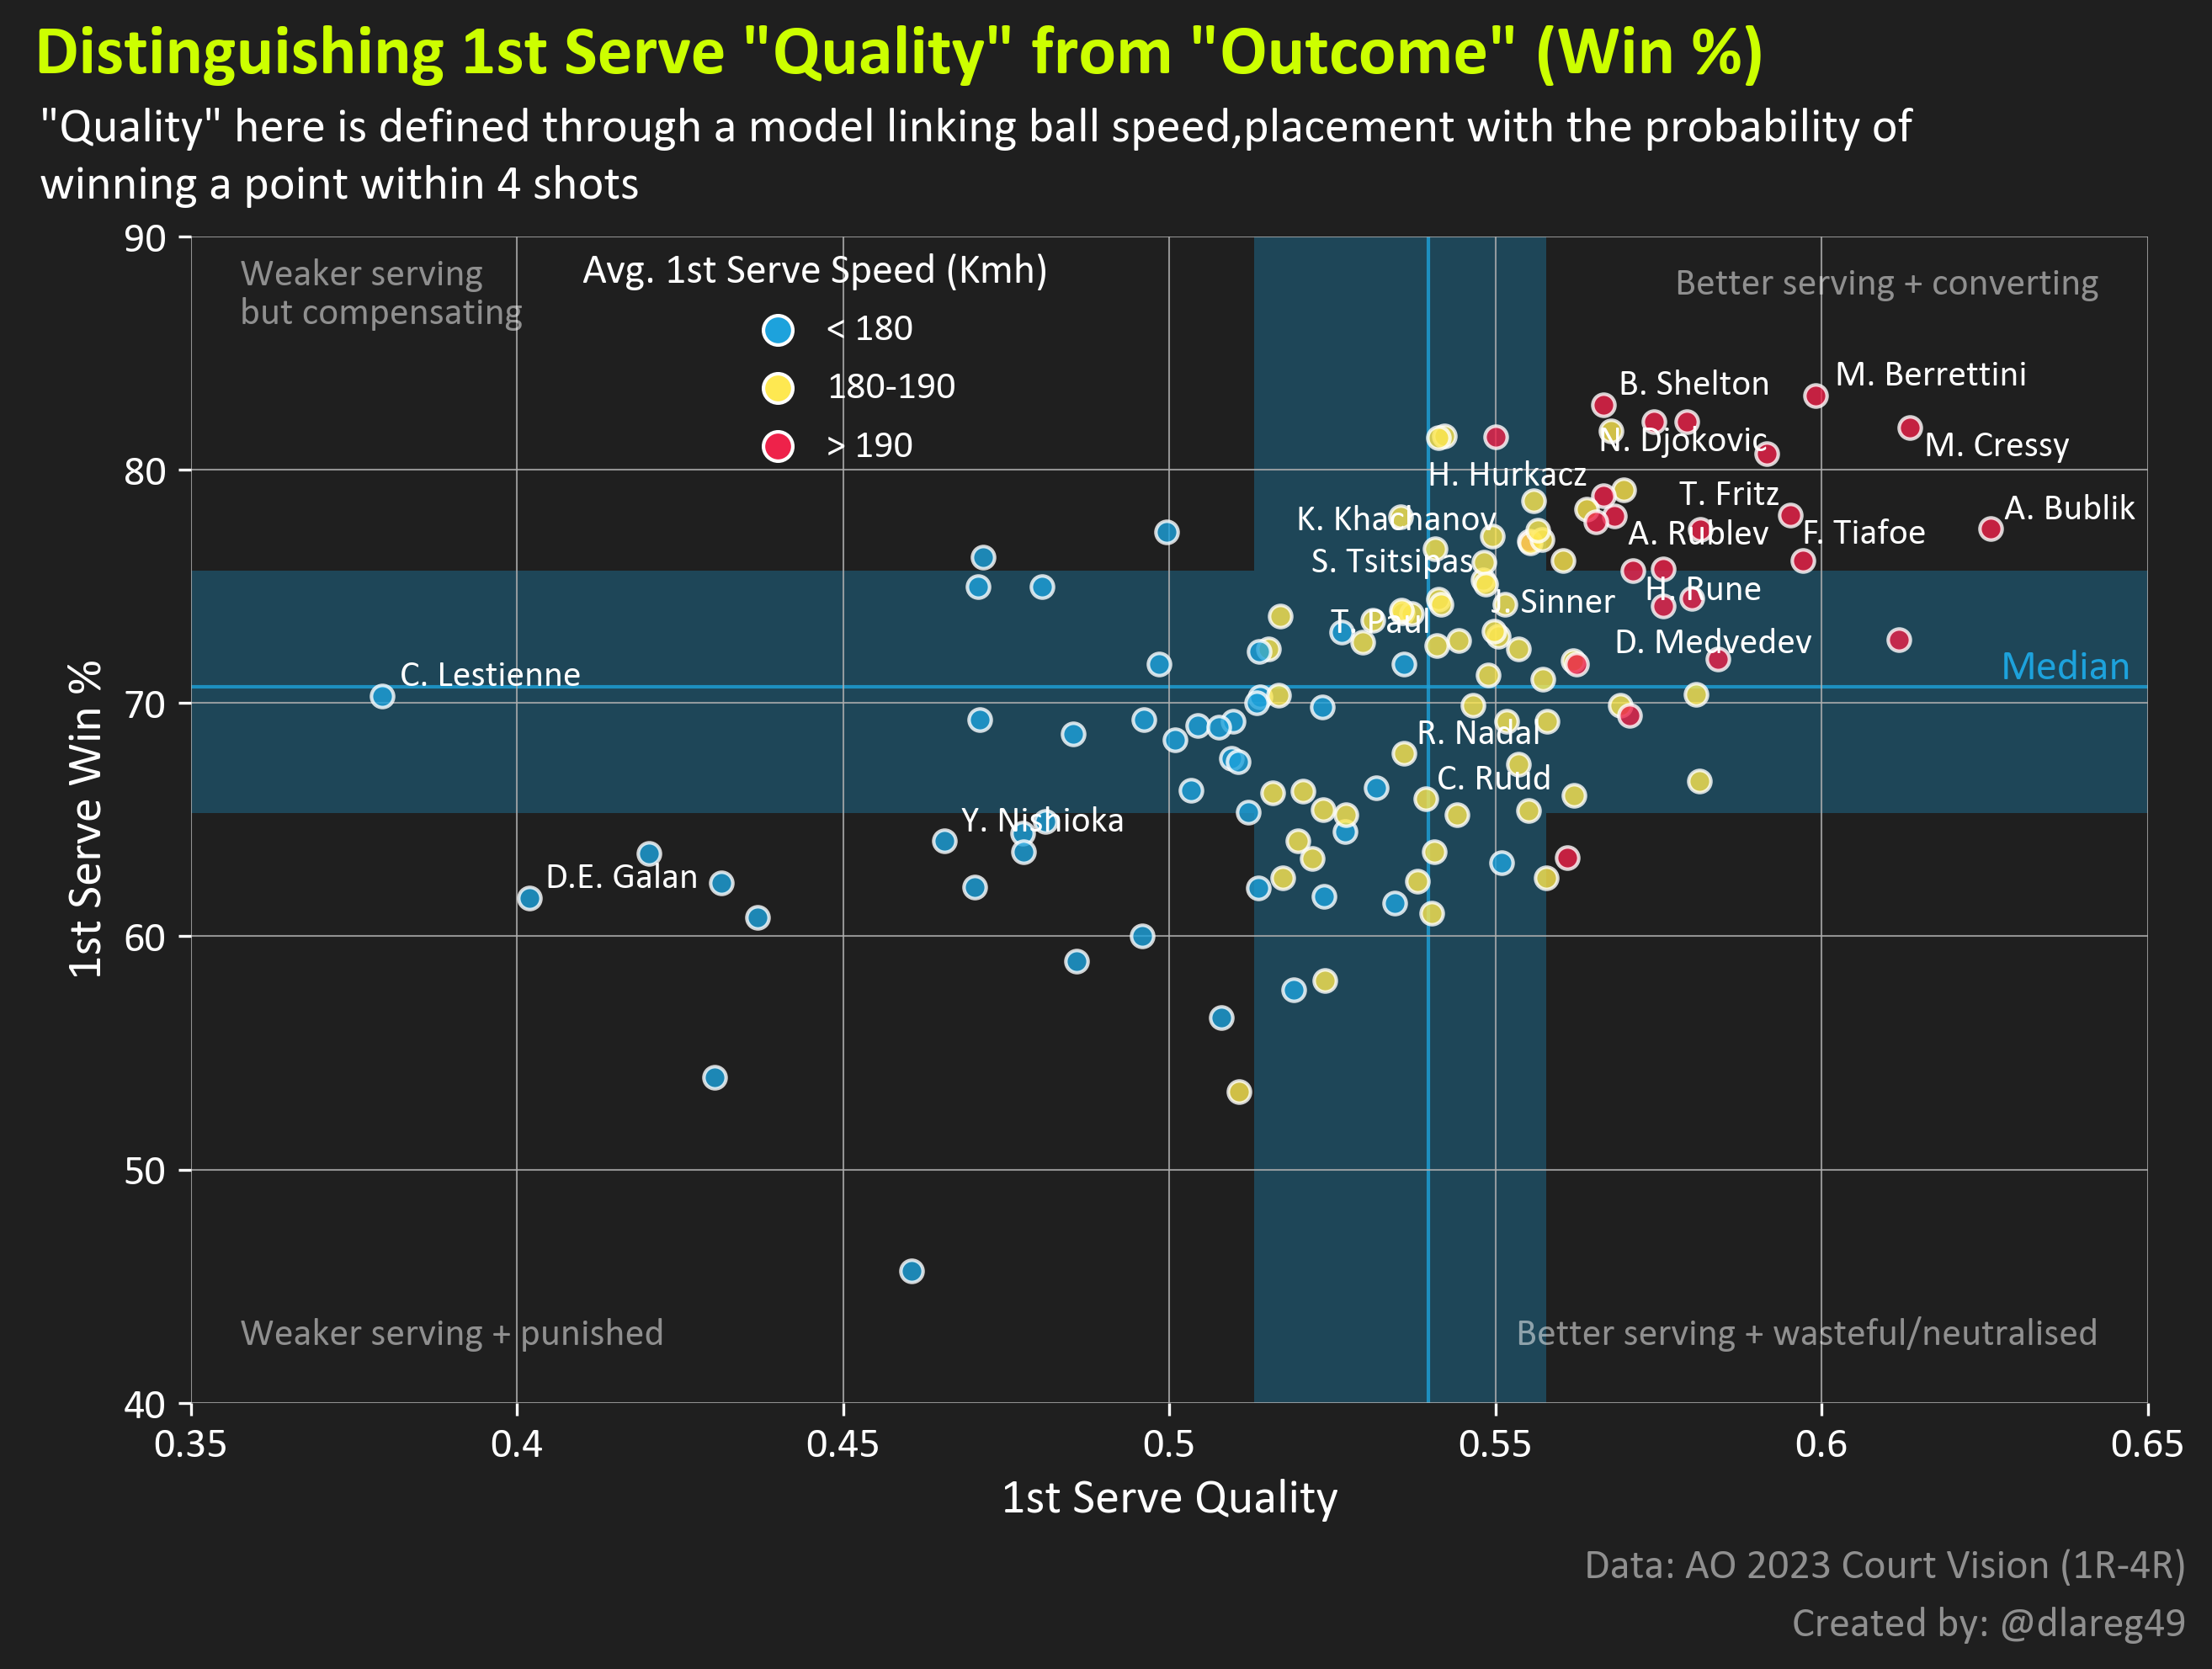
While useful, traditional/mainstream stats such as Ace Count/ 1st Serve Win %/ Return Points Win % are influenced by noise such as subsequent rally shots or player quality and don’t exactly attempt the measure the quality of the shots in question themselves. While all stat kinds should regress in the long run, more granular types could have value on intermediate timescales, e.g. someone like Tsitsipas could be coming into a tournament final with a higher-than-usual return points won %, but could this be due to him having a sustained return improvement or facing lower quality serves overall in the rounds prior?
Leaving you with a “few tools”
To end this post off, here’s a link to my project on github. Future plans may be to update it to scripts that run on a schedule and update a DB or something but this should get you started for now if you’re interested. As always, be polite to the sites that you’re scraping; tennis tracking data is hard to come by for the fanalysts, so let’s enjoy this means of collecting the data while it lasts.