Collecting my own Tennis Event Data | Nadal-Djokovic EP-59 Data Story
in Tennis on Tennis, Atp, Analytics
Having dabbled in sports analytics for 2+ years or so now, one thing that us hobbyist practitioners have largely taken for granted is the availability of data itself. While accessibility of more granular data types (e.g. event/tracking) is generally decent for football thanks to certain providers, the same can’t be said for my other favourite sport, Tennis. The summrary of this tale is that I spent about 2 weeks tracing every single shot of the Nadal vs Djokovic match at this year’s Roland Garros, managing to keep my sanity intact whilst gaining a deeper appreciation for both players’ tactical choices and execution. After some background about what compelled me to attempt this arduous task, I’ll share several lessons I took from this experience and then a visual-heavy data/analytics report of the match that I charted. (I’ve also put this data public on here.)
So, what have the data options for the fuzzy ball-hitting sport been? Besides the Tennis Abstract Match Charting Project (which is brilliantly crowd-sourced and contains over 10K matches and counting) which provides point-by-point data of individual shot type and general direction, the only other resources with a significant catalogue of matches would be the Australian Open and Roland Garros’ websites and their Match Centre widgets (cheers Infosys). Although you only get to visualise serves/winners/errors, it is at least possible to scrape the data and produce some neat looking aggregated visuals. If those aren’t enough for you, there are only 2 matches that I’m aware of which have ball positional data for every stroke publically available: 1) the 2019 Australian Open Men’s Final - which was very generously charted by Rob Seidl and 2), the 2021 Roland Garros Men’s Final, which even contains z-coordinates! Thus, here is my modest contribution to the amateur tennis analytics community, with the hopes that data science and analytics in tennis can be thrust into the mainstream consciousness like how we’ve seen in football, basketball and others.
Tools and the Process
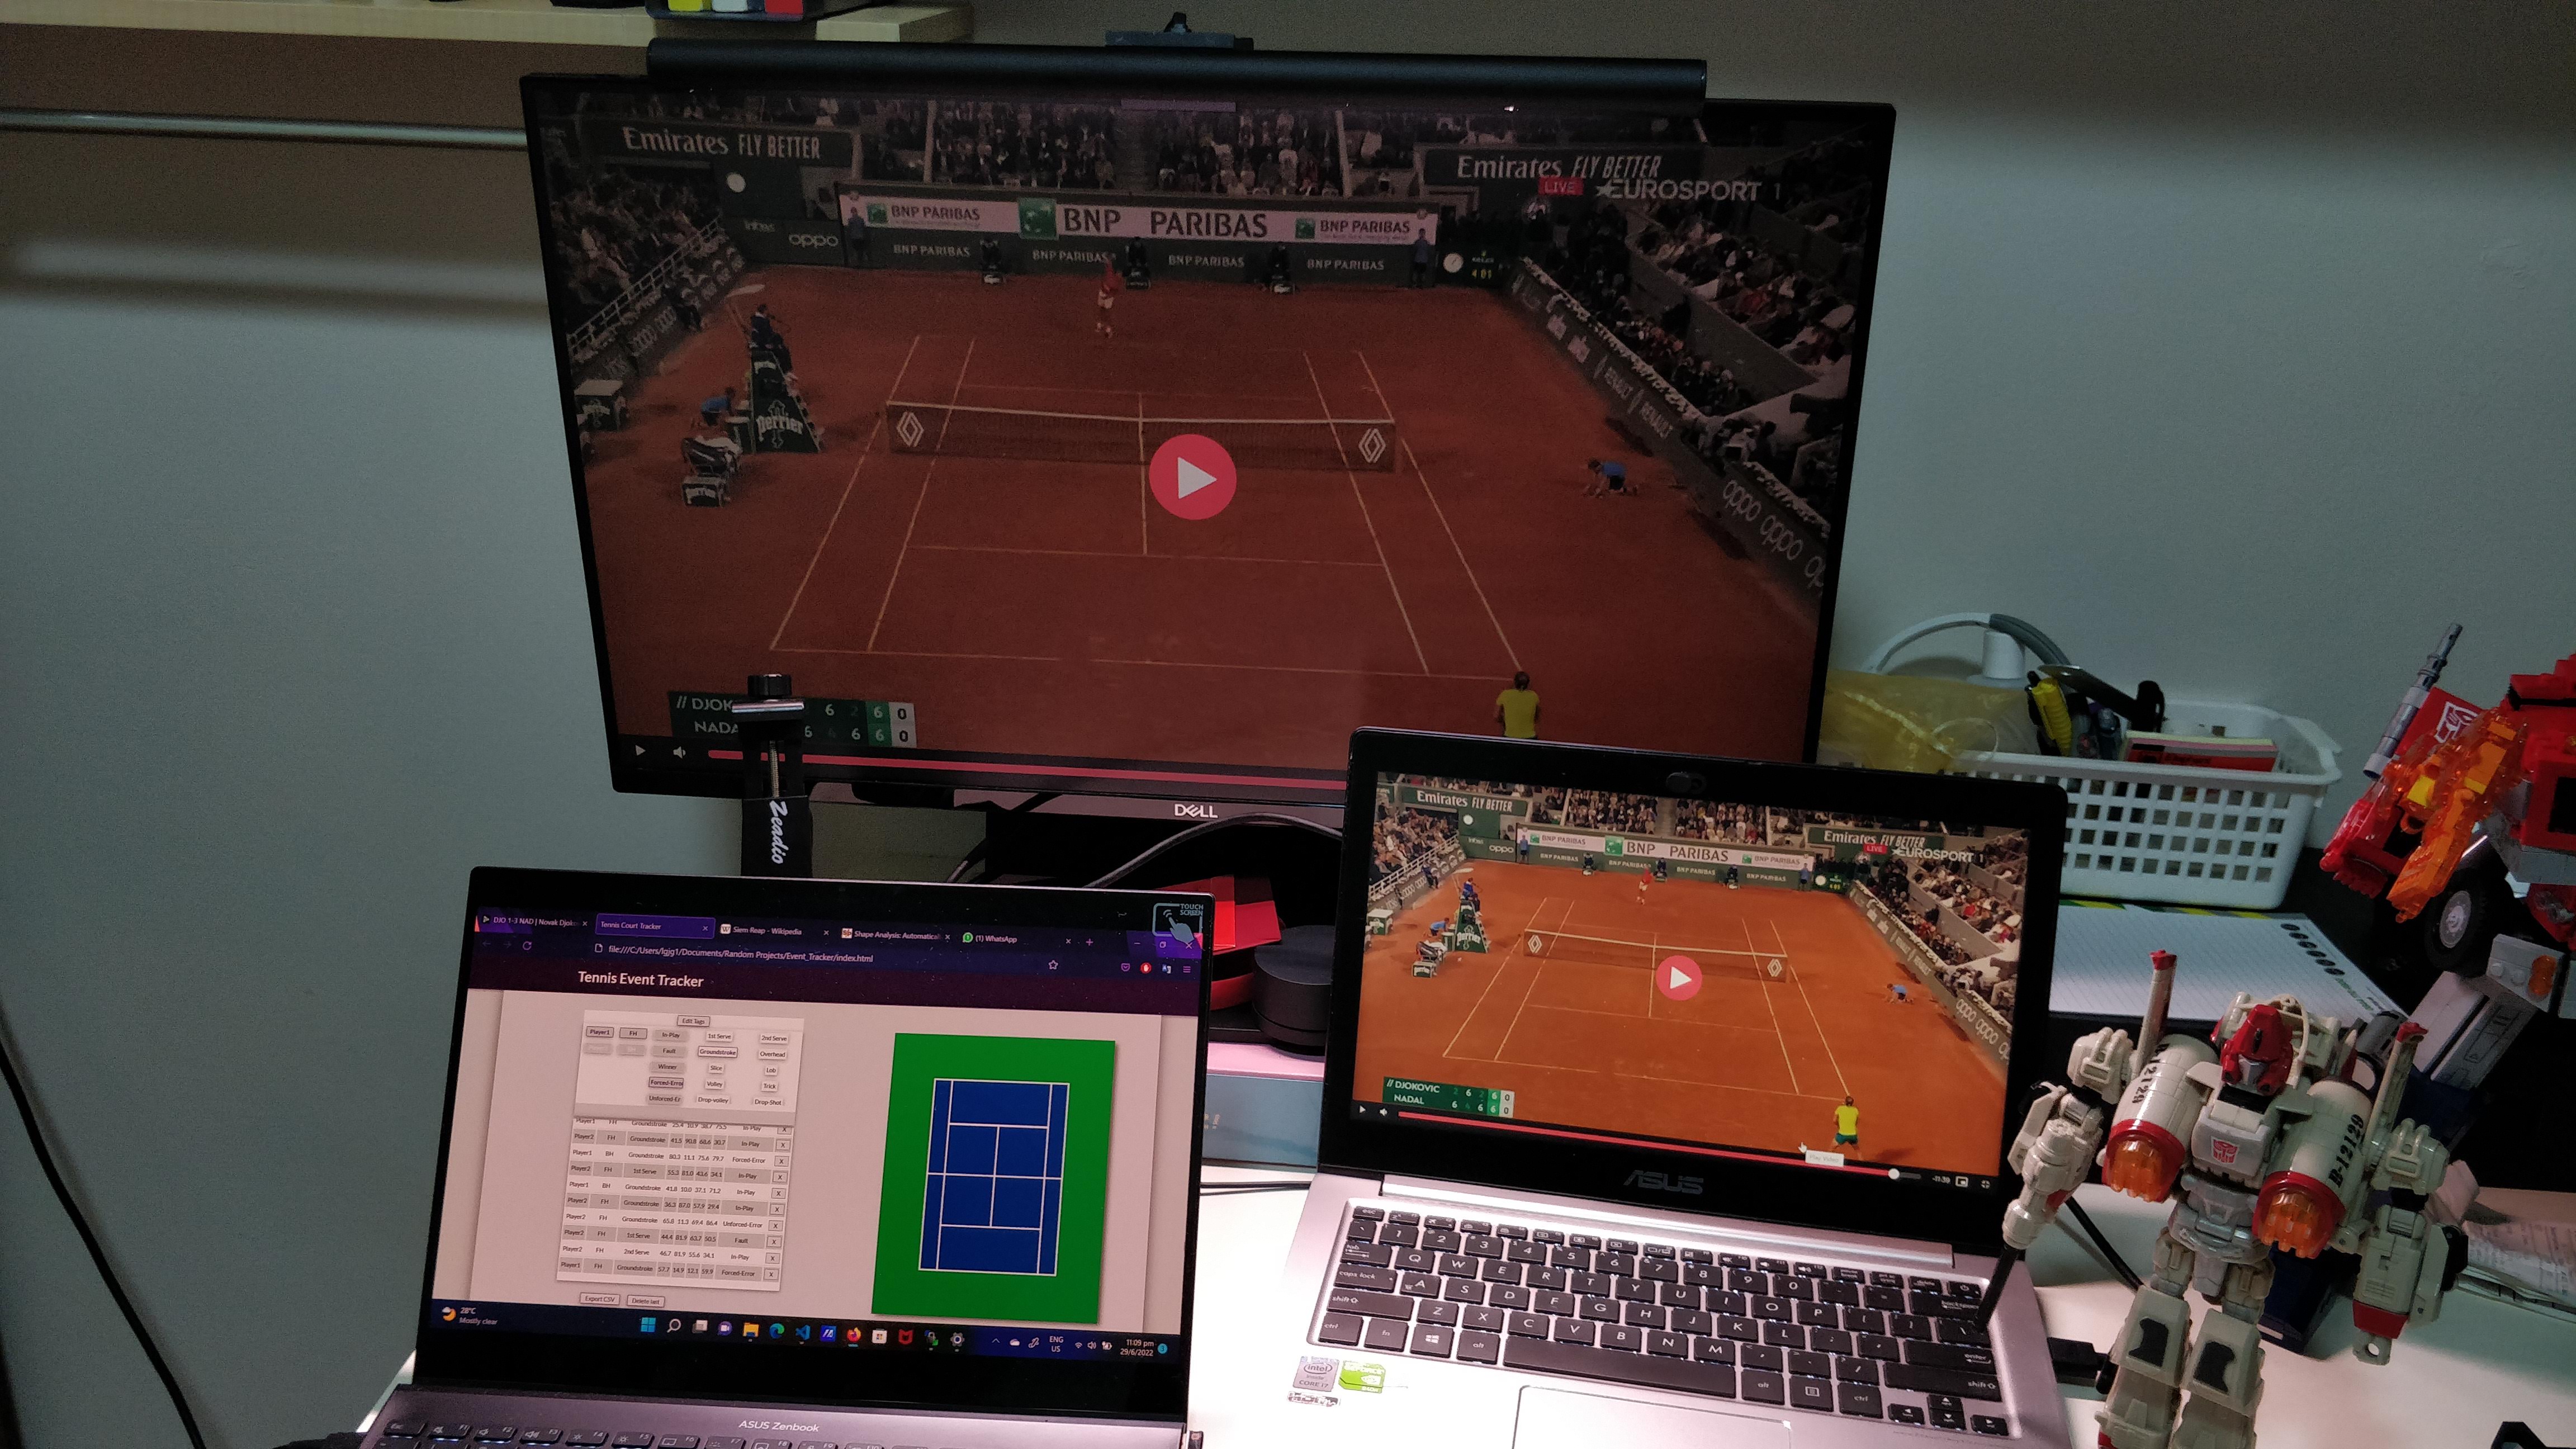
My method of data collection was, for lack of a better word, primitive. In short, I edited a Tennis Court into this event data collection web-app created by FC Python. You might be thinking, wait…so every shot was manually traced by hand - that’s retarded (you’re not wrong). Thankfully, my new laptop that I recently purchased had a touchscreen and came with a stylus - really useful for this purpose. While I was aware of alternative (and smarter) collection methods, e.g. overlaying the footage in a software like ARCGIS as mentioned in this article, or via homography techniques such as Direct Linear Transforms which Rob used to collect his dataset; my unfamiliarity with those methods + my curiosity over how much manual tracing I could withstand kept me on this less sophisticated path.
In total, I traced the shot data over a span of about 2 weeks and probably 20+ hours or so - not too terrible a ratio for a 4+hour long 4 set match I suppose. Despite the task being rather repetitive and menial, I definitely came away with some takeaways from this experience:
Data Collection isn’t easy
Although the role of computer vision continues to grow in data companies, the human contribution is still an indispensable component of the overall workflow, be it in the collection process itself or for sanity checking/quality control purposes. As Statsbomb themselves put it, “Humans and machines combined has always produced better results than humans and machines working independently”. This article from 2014 described the hand-eye coordination required by Opta’s data loggers as being that of avid Playstation gamers, in addition to five-hour selection tests and probation periods of up to a month before being “match-ready”. Given the pace at which I was the going and the frustrations endured, I’m probably far from being up to the task in a professional setting.
And far from perfect
My collection method probably didn’t help here, but staying consistent with my logging of the positional data was a huge challenge. This was especially so for ball-racket contact points where I lacked the visual reference of the court margins. Perhaps in the future, I’d try to collect the data in a more precise manner - pasting a ruler or two over my monitor might even help.
Curse of Knowledge
Another challenge that would’ve been reduced if I used a proper court overlay/homography technique was the interference of my own biases resulting from my existing knowledge of the two’s playstyles and strengths. For example, Djokovic’s return-of-serve, widely regarded as possibly the greatest of all time, played in my head on almost every occasion when he landed a return in past the service line. This may have unfortunately caused me to systematically record a number of returns as deeper than I would have if Nadal had hit them. Another example would be knowing that Nadal tends to play from a deeper position, hence could I possibly have been thinking that he’s stood deeper than he actually is?
Definition Dilemma
You’re always going to find irregularities in data between different providers and I’ve come through this experience with greater empathy for those who have to decide on the “truth”. A much debated statistic in tennis is the Unforced/Forced-Error differentiation, with some analysts even advocating to only deal with errors as a whole. I tried to be as consistent as I could here and only counted unforced errors as those where I reasonably judged the offender to have time to set up for his shot. I ended up being much more lenient with 61 unforced errors logged than the official count of 96.
Nadal vs Djokovic Episode LIX: A Data Story
In this half of the post, I’ve taken the collected data to present a data and visual-driven story of 10 key features of the latest and 59th clashing of these two titans.
Thanks to Nadal’s abdomen, this edition of Nadal vs Djokovic remains the most recent and hopefully, still worthy of a revisit. Lamented by many for being drawn as a mere quarter final, Djokovic had come into this meeting as arguably the in-form player, having coasted to the Rome Masters title and not dropped a set since his closely-fought defeat to Carlos “The Real Deal” Alcaraz in Madrid just under a month ago. After an infamous and inconsistent start to the year, the then World #1 appeared to finally be back in grand slam-contending groove. Nadal on the other hand, despite a blistering 20-0 start to 2022, wasn’t giving the bookmakers much confidence with lingering doubts over his Mueller–Weiss syndrome, as well as his overall fitness following a rib injury. Furthermore, he had just come through a 4H23M long tussle with Felix Auger-Aliassime in just his third 5-setter on the Parisian Clay, whereas Djokovic’s contest with Diego Schwartzman lasted a mere 2H17M. Did I not mention the last meeting between these two yet - a monumental 4 set victory for Djokovic a year ago in the semi final.
Before I get to the match review, a shoutout to other analytically-focused reviews of this match which were very useful references - especially so since this was my first time writing a match report-type piece.
- How Rafael Nadal defeated Novak Djokovic at the 2022 French Open (On The Line Tennis)
- Rafole reversion to the mean in Paris (The Racquet)
- Djokovic vs. Nadal French Open 2022 QF | Post-Match (Gill Gross)
This was the 59th match (18th in grand slams, 10th at this tournament) between Nadal and Djokovic with the Serb leading the h2h 30-28. Keen observers have noted that since 2018 (post both players’ respective early 30s slumps) this rivalry has largely been surface-skewed, with Nadal leading 4-1 on clay and Djokovic 3-0 on the other surfaces. As dusk set in and the summer air cooled to a blanket-requiring chill, a 4H12M-long battle unfolded which captivated the Chatrier crowd again with every stroke and grunt. In the end, the King of Clay claimed his revenge with a 6-2, 4-6, 6-2, 7-6(4) victory and stayed on course to an eventual 14th Roland Garros title. While it may not have reached the dramatic peaks of last year’s epic, there was definitely no shortage of tension and moments of sheer brilliance. With the aid of the collected data, here are 10 noteworthy dynamics that tell the story of this contest.
1. Serving up a Storm
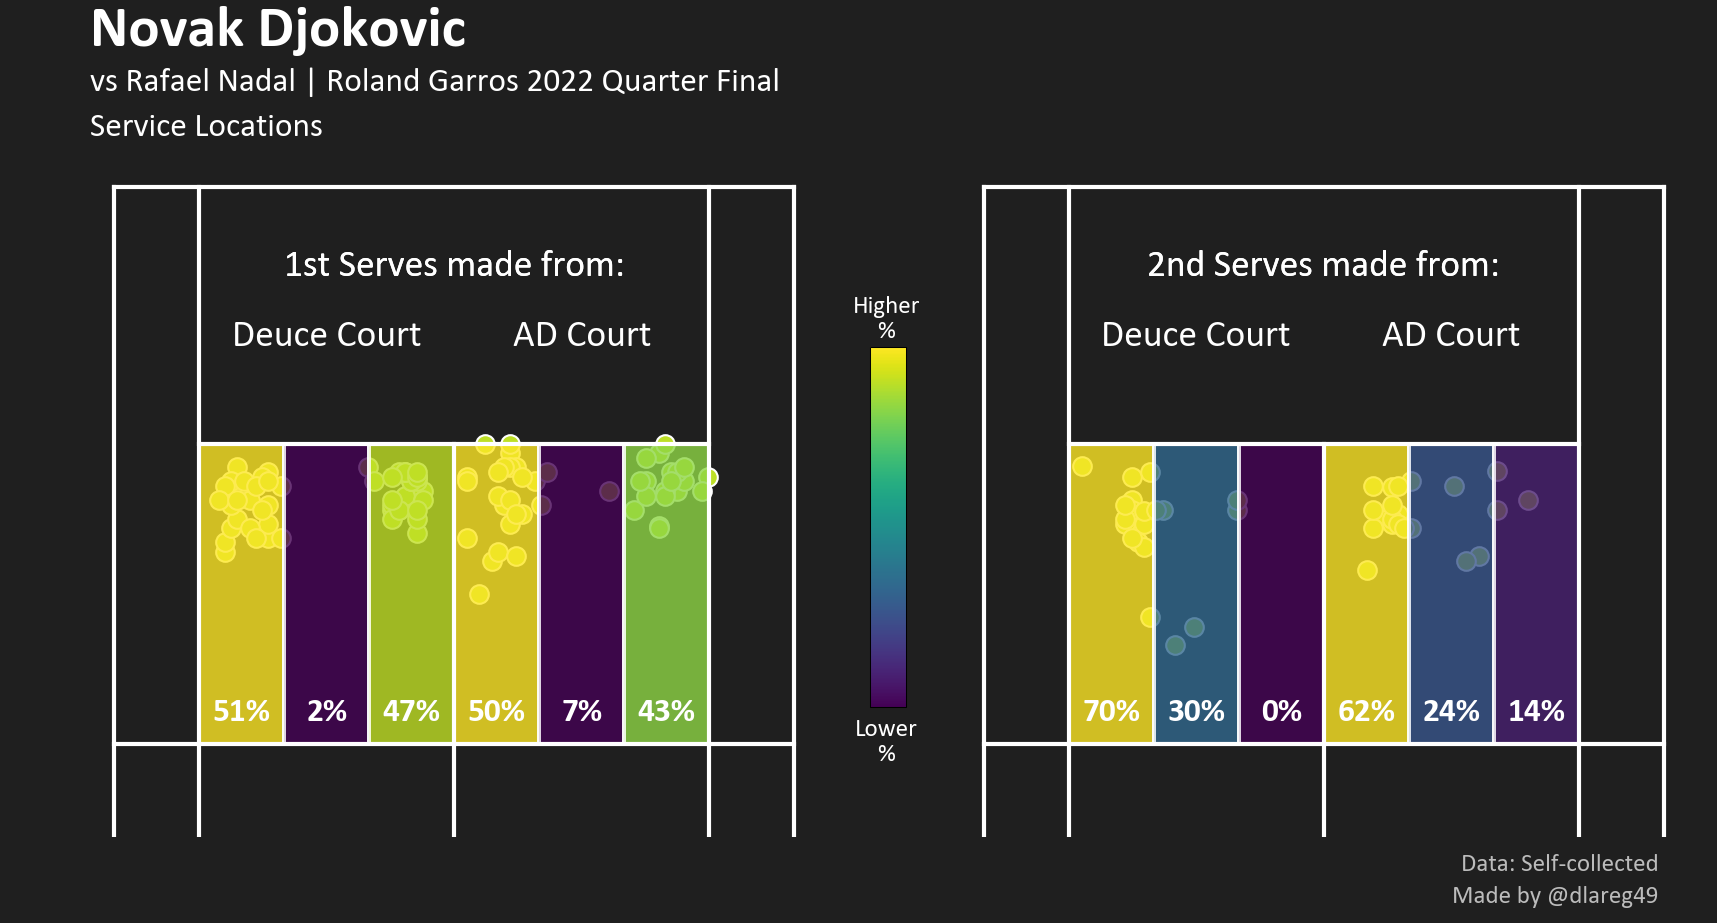
Djokovic is generally regarded as the stronger server of the two (see Wimbledon 2018), although clay negates this advantage as a slower playing surface. Nadal edged Djokovic in terms of 1st serves made in-play (71.0% vs 67.9%) and 1st serve points won percentage (65.3% vs 64.2%), while committing the same number of double faults (4). Although the stat sheet showed that Nadal served 2 fewer aces than Djokovic (3 to 5), he induced more forced-errors from his first serve (14 vs 9). As seen in the 2 figures below, Djokovic split his 1st serves from both sides relatively evenly down the T and out wide (see Appendix for binned % distributions). His Deuce-Wide and AD-T serves (the more “natural” directions for a right-hander) were slightly more successful than their opposites.
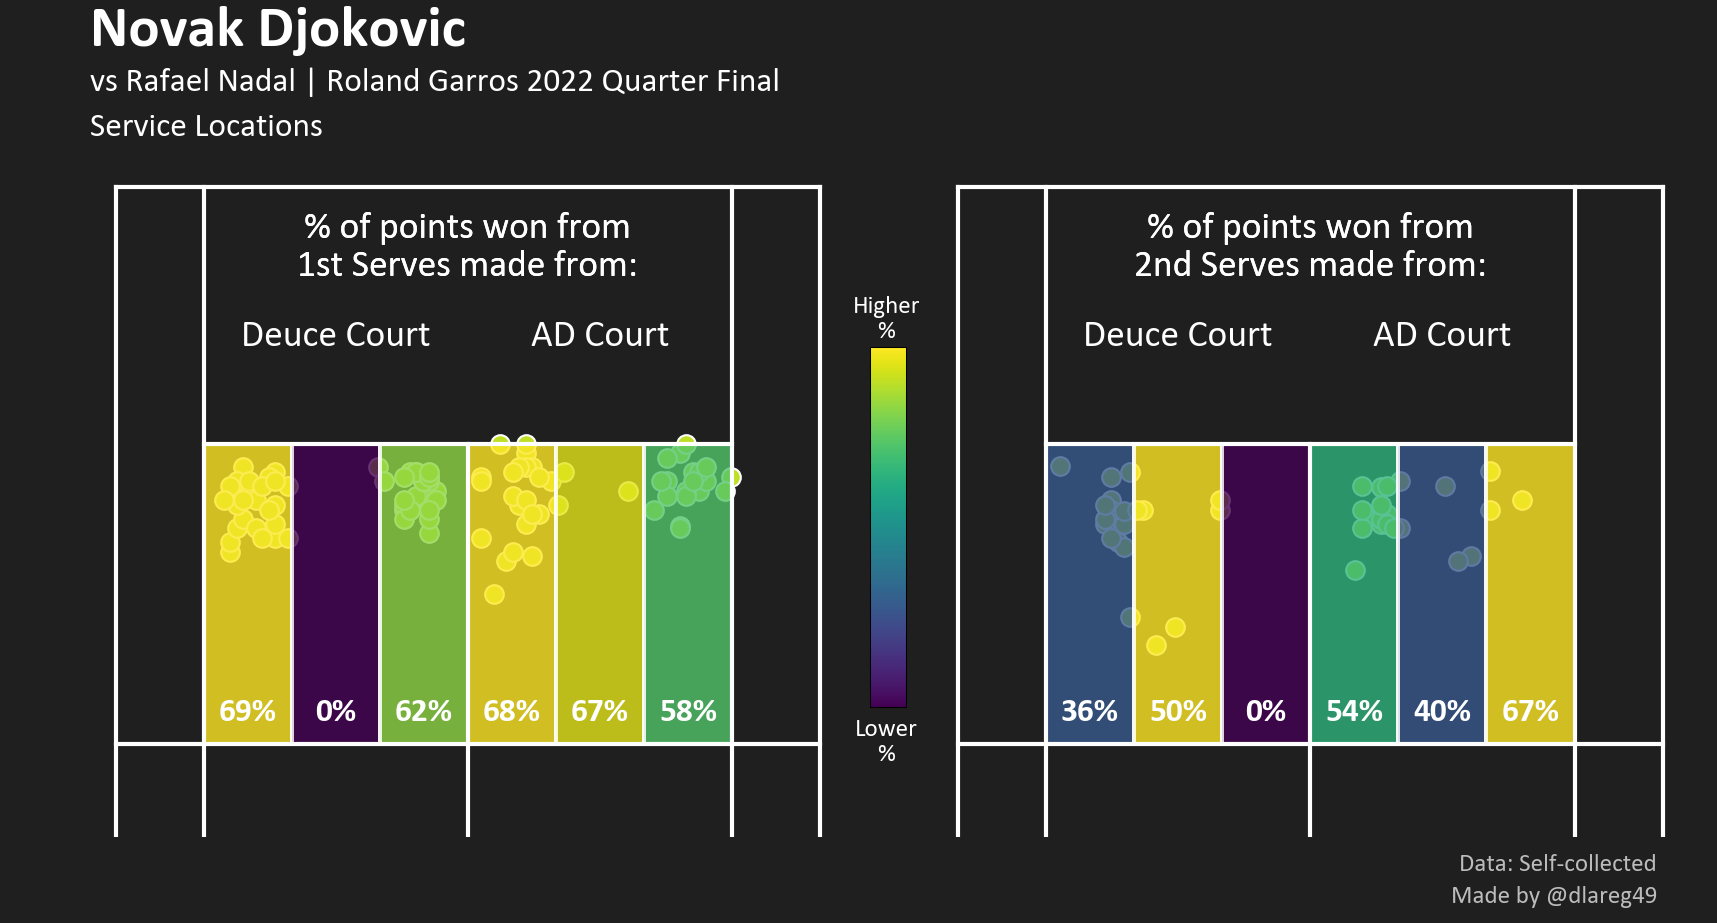
Double Faults are excluded from this figure.
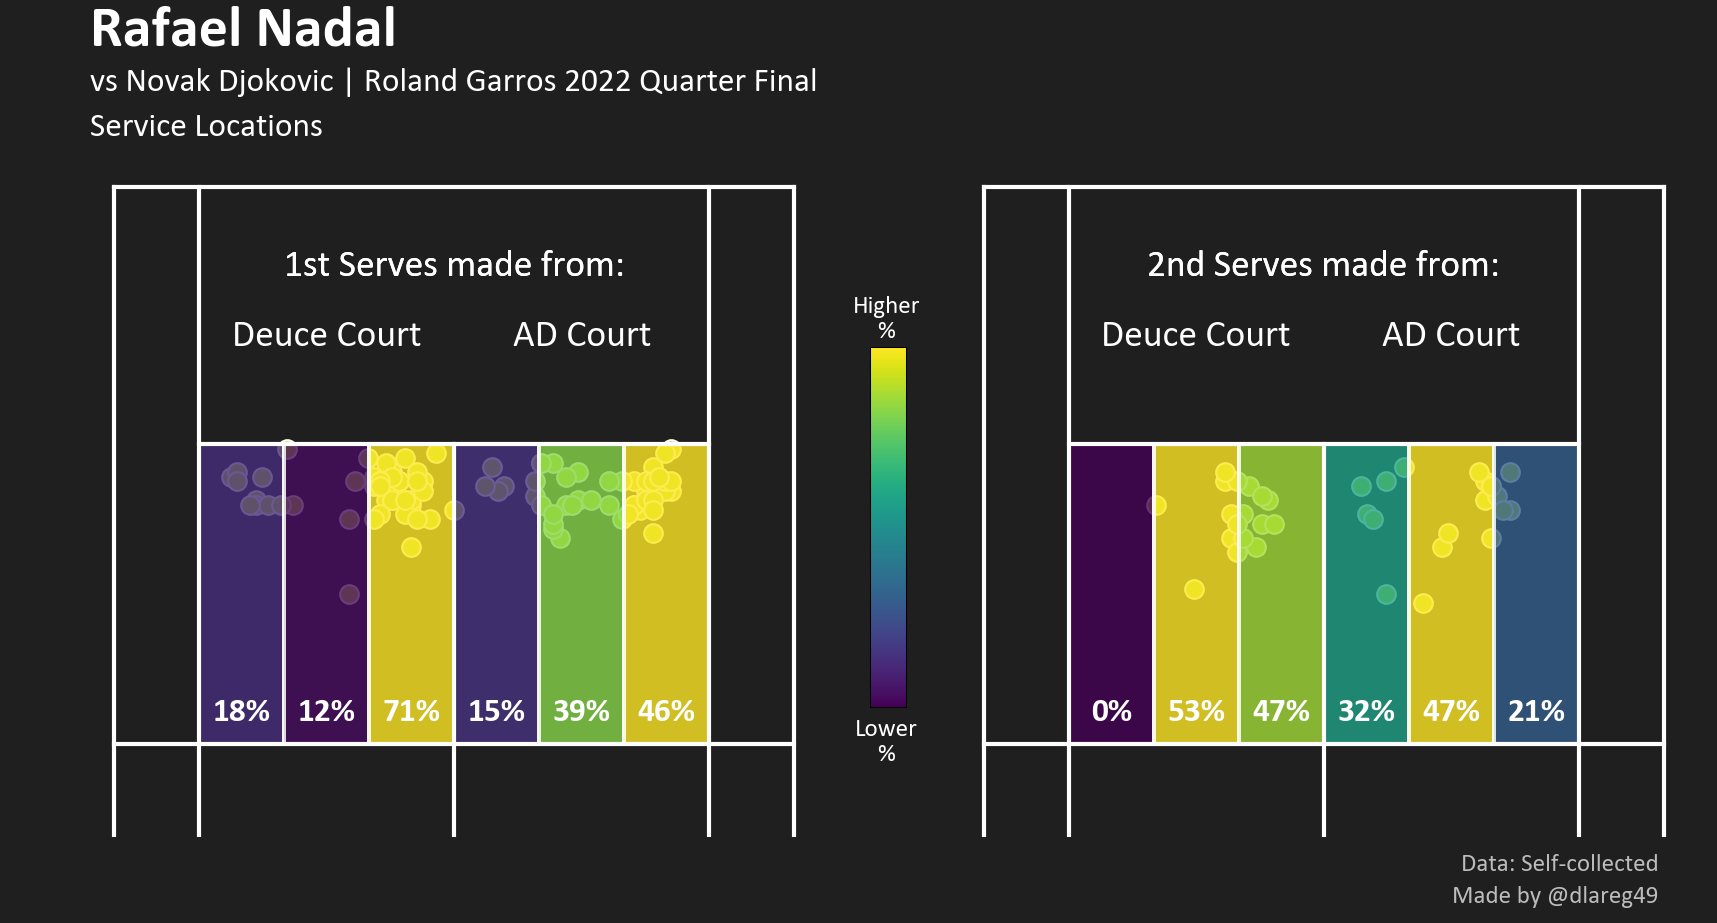
Nadal conversely, served significantly more towards Djokovic’s backhand from both ends to prompt a follow-up forehand shot. He also gained value from his “surprise” Deuce-Wide and AD-T serves, winning 78% and 86% of those points respectively.
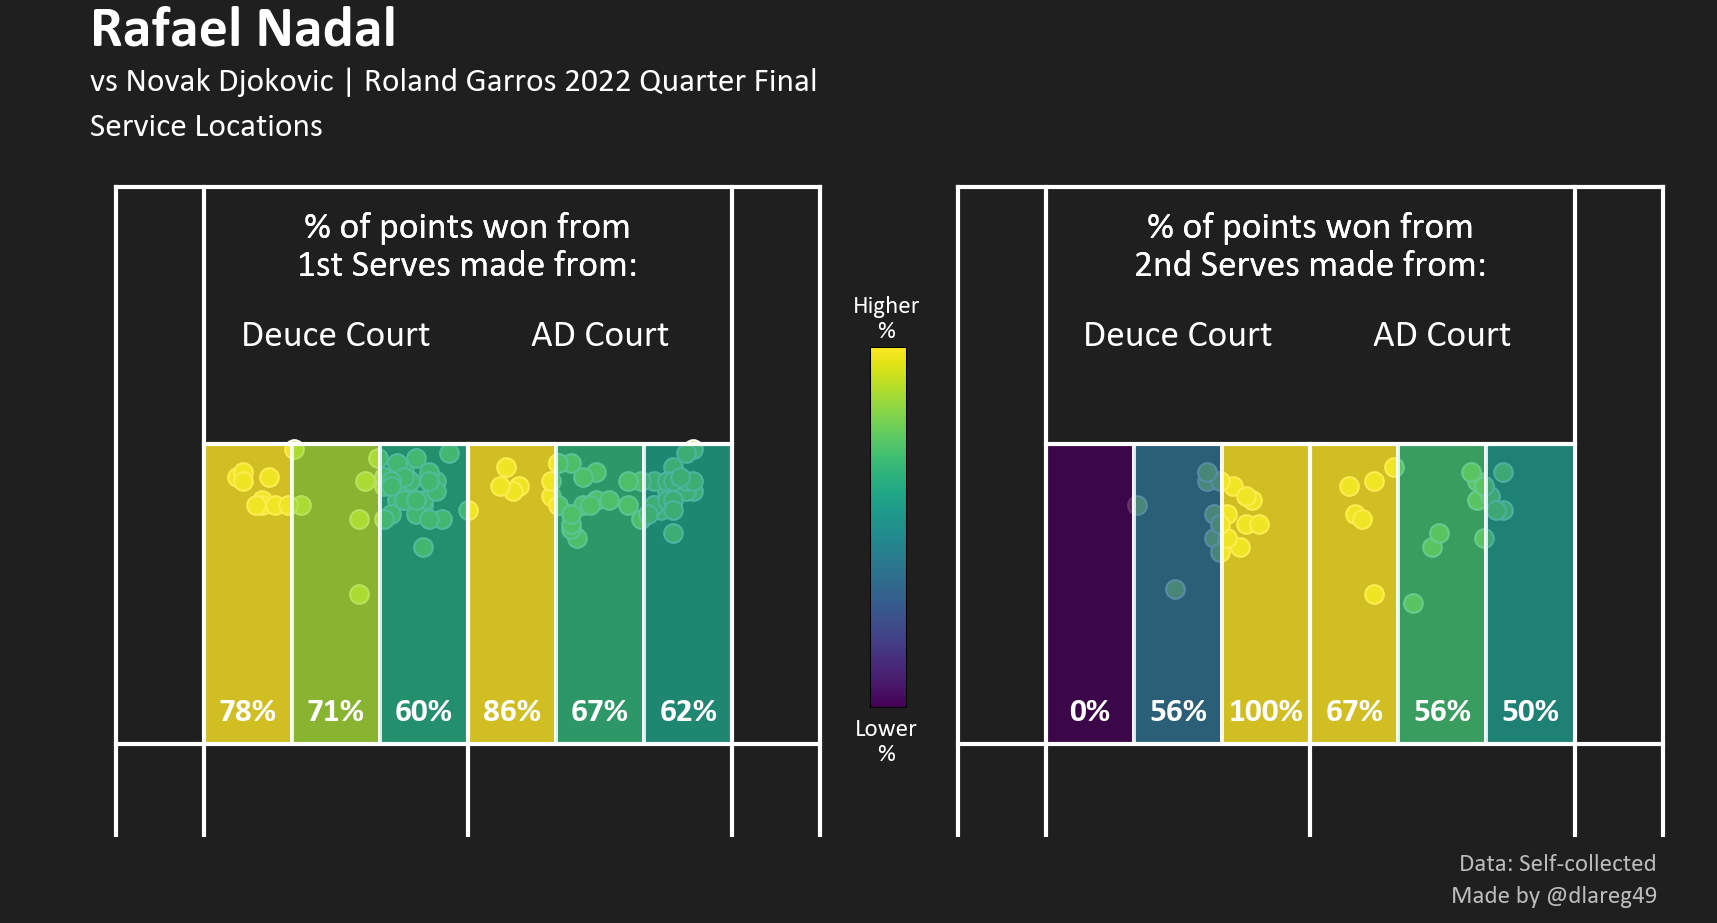
The second serve was where their fortunes diverged most as Djokovic only won 42.2% of his, far below Nadal’s 60%.Djokovic sliced a majority of his second serves wide from Deuce and down the T from AD side but was markedly more successful from the latter (54% win percentage to 36%) despite being unable to force a single backhand return from the AD side. Nadal served more or less exclusively towards Djokovic’s backhand from Deuce which yielded much more success than his AD serves which had more variance (50%).
I also went through the trouble of recording down every single visible serve speed displayed on the on-court Infosys meter. The figure below shows the spread of all recorded first and second serve speeds for the 2 players, split across the four sets.
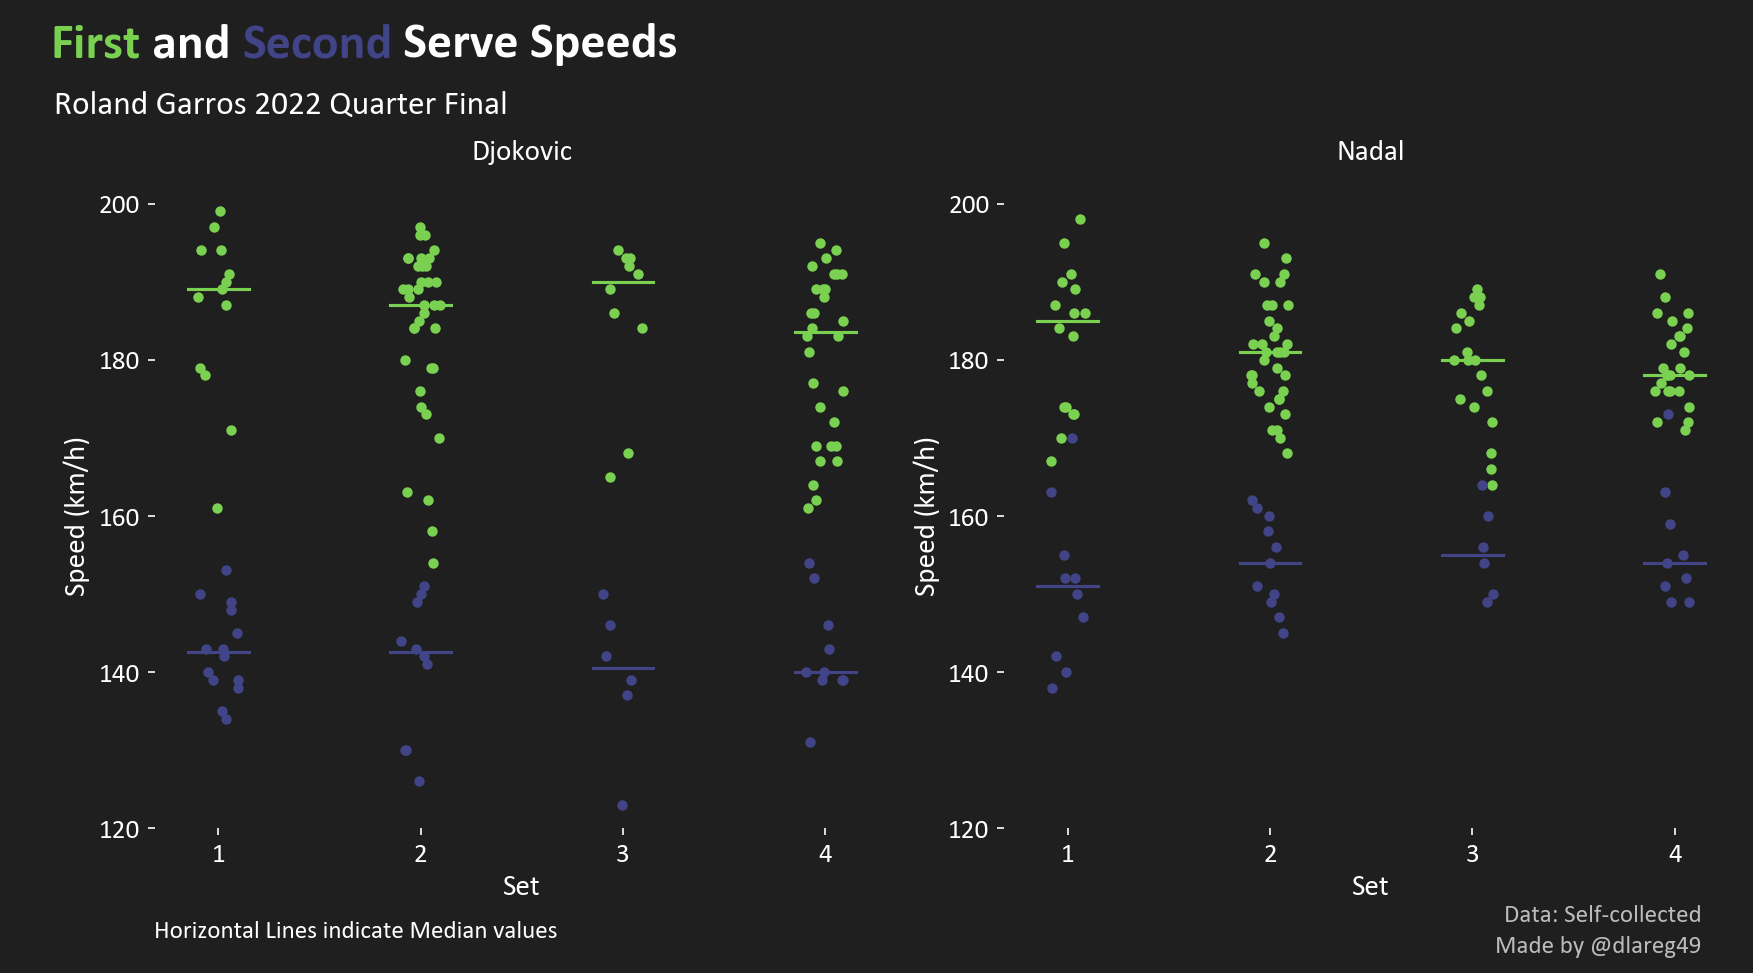
Djokovic’s 1st serve averaged 184 km/h compared to Nadal’s 181 km/h and appears to have 2 “clusters” across all sets. The “slow” clusters in the 150-170 km/h range were largely from his sliced Deuce serves out wide, where raw driving pace was sacrificed for spin/direction. Curiously, Nadal’s median 1st serve speeds trended downwards as the match went on. Nadal’s more aggressive second serve which he has adopted in 2022 was on display again, as he boasted an average speed of 154 km/h (up by 8 km/h from 2021) against Djokovic’s 138 km/h. In fact, if you squint closely, you can see that he even registered 2 second serves that were faster than a number of his firsts.
2. Novak’s streaky Return feat. a Nuclear Peak
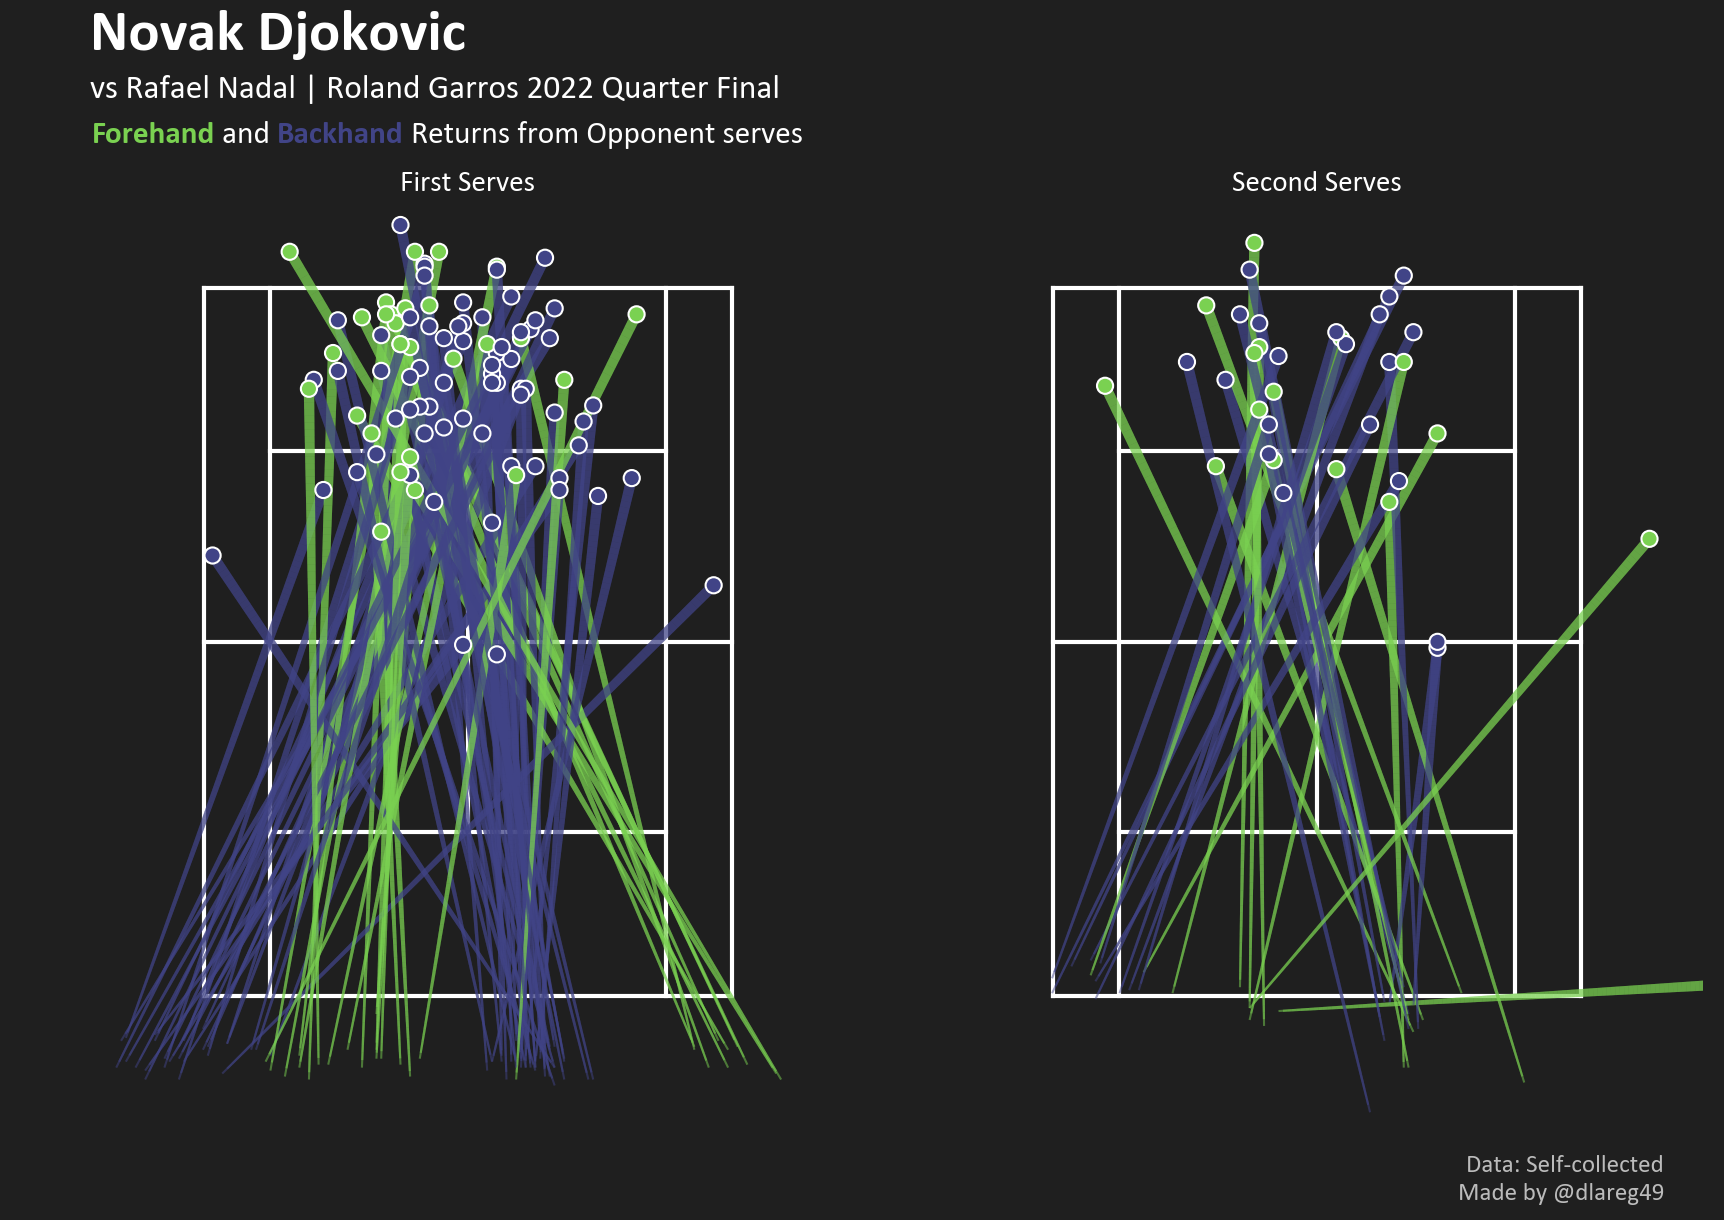
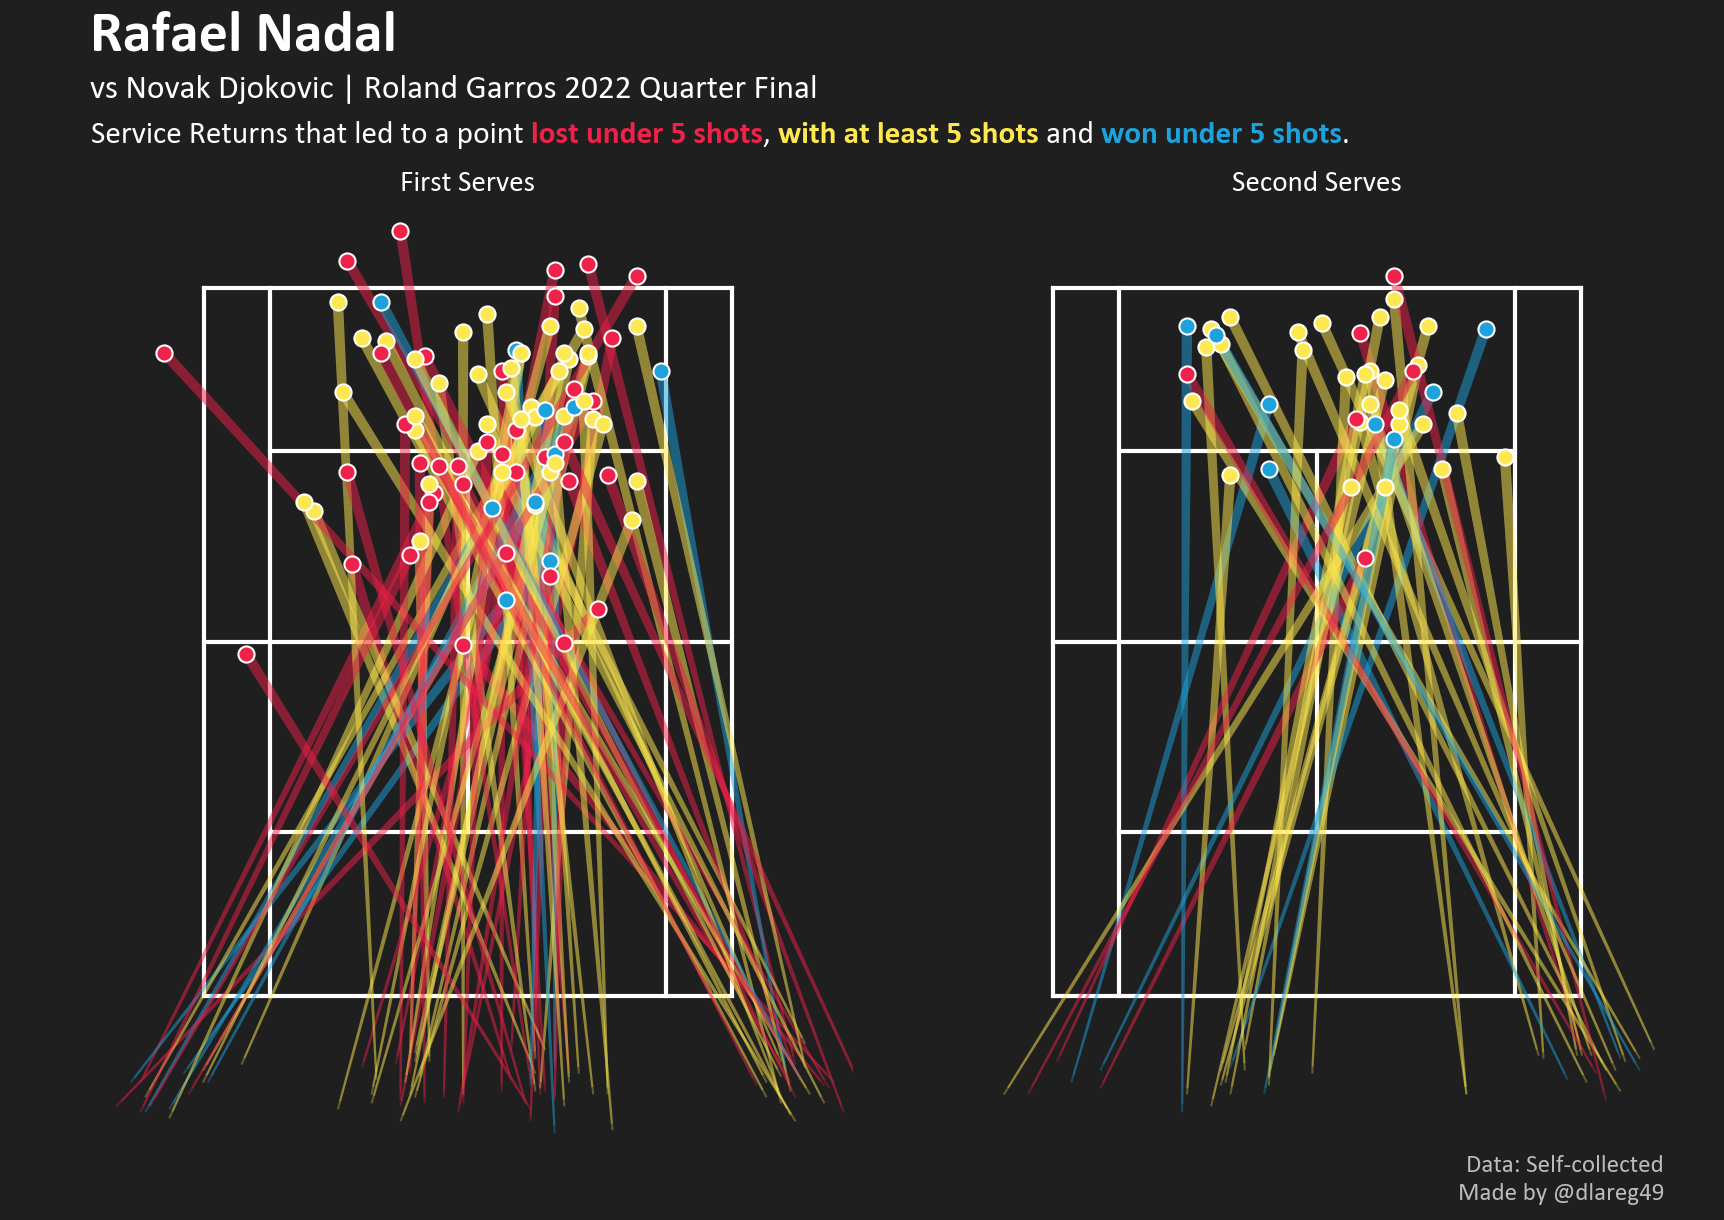
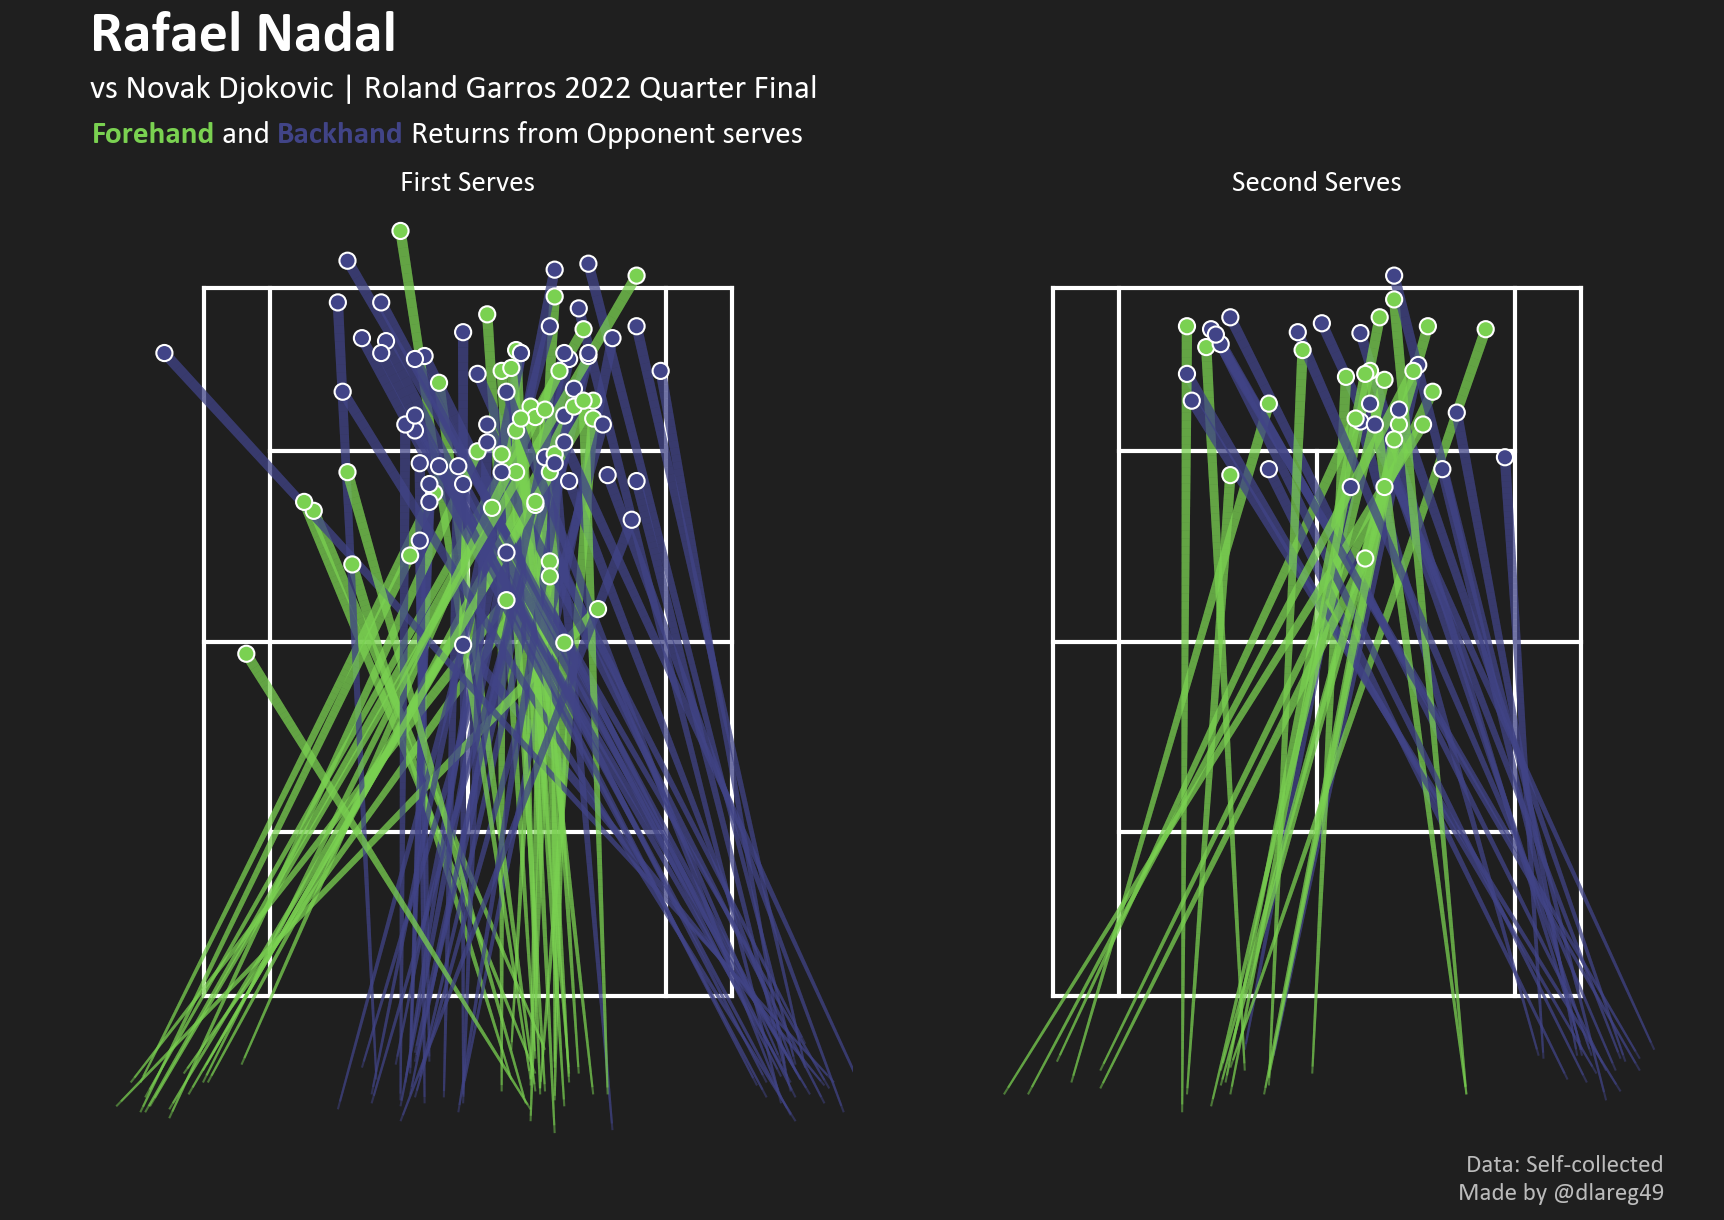
While Nadal poses a slightly better historical % return points won statistic, Djokovic’s return-of-serve is widely acknowledged as the much more aggressive and greater shot, with some critics going as far as to term it as his “Third Serve”. The depth and precision of his first serve return depicted below paints the picture of yet another world class returning display.
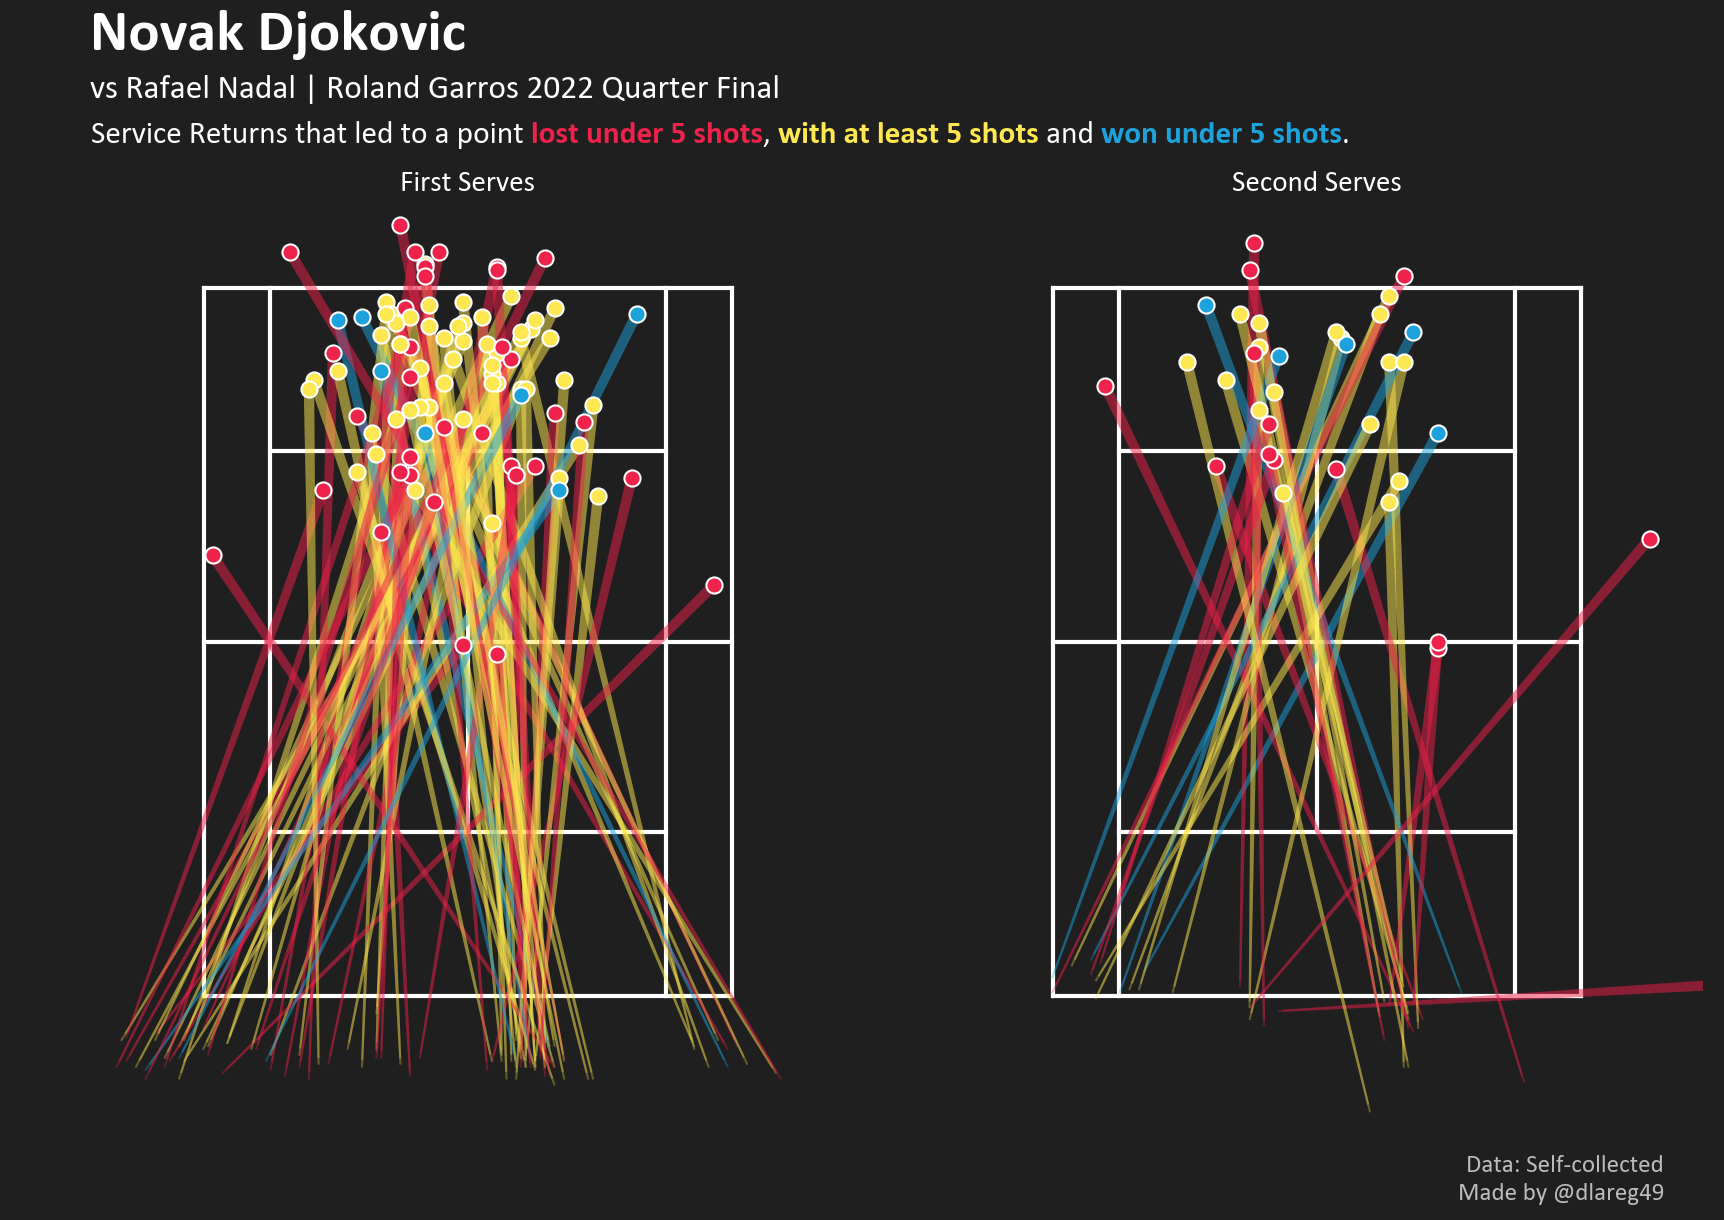
On the stat sheet, Djokovic’s first serve return points won % matched Nadal’s pretty well (for a losing effort, 35% to 37%) but as discussed before, the second serves were where it unraveled for him (just 33% won to Nadal’s 51%). We see in his return map that 8 returns didn’t even make it back in play (thanks to several aggressive Nadal serves too); whereas Nadal managed to for all but one. Nadal’s key to returning lies in his ultra-deep court positioning and while he doesn’t achieve the same level of first serve return depth as Djokovic, his groundstrokes do typically contain more topspin which mean that they rebound with greater height, especially so off clay. On Djokovic’s second serves, he maintained this conservative positioning, which buys him time to shuffle across and return with his forehand as shown in the graphic below.
While Djokovic’s overall return game was below average and inconsistent as a whole, there was a frightening peak for much of the second set. After a careless game by Nadal to hand back a break and Djokovic consolidating to inch back to 2-3, the Serb began an incredible ball-striking stretch. Nadal gets battered off the court on multiple points - having to hit practically half volleys off Djokovic’s returns, and after an 18 minute game that crossed deep into deuce purgatory, the Mallorcan gets broken to level the set at 3-3. Then after yet another game dragged to deuce at 4-5, Nadal finally cracks and gets broken to lose the set on a long forehand down the line.
Despite seemingly having the momentum going into the third set, Djokovic’s level proved to be a purple patch as he got broken in the first game and conceded the third set 2-6 in 41 minutes. His return points won % slumped back down to the 30s after redlining to 50% in the second.
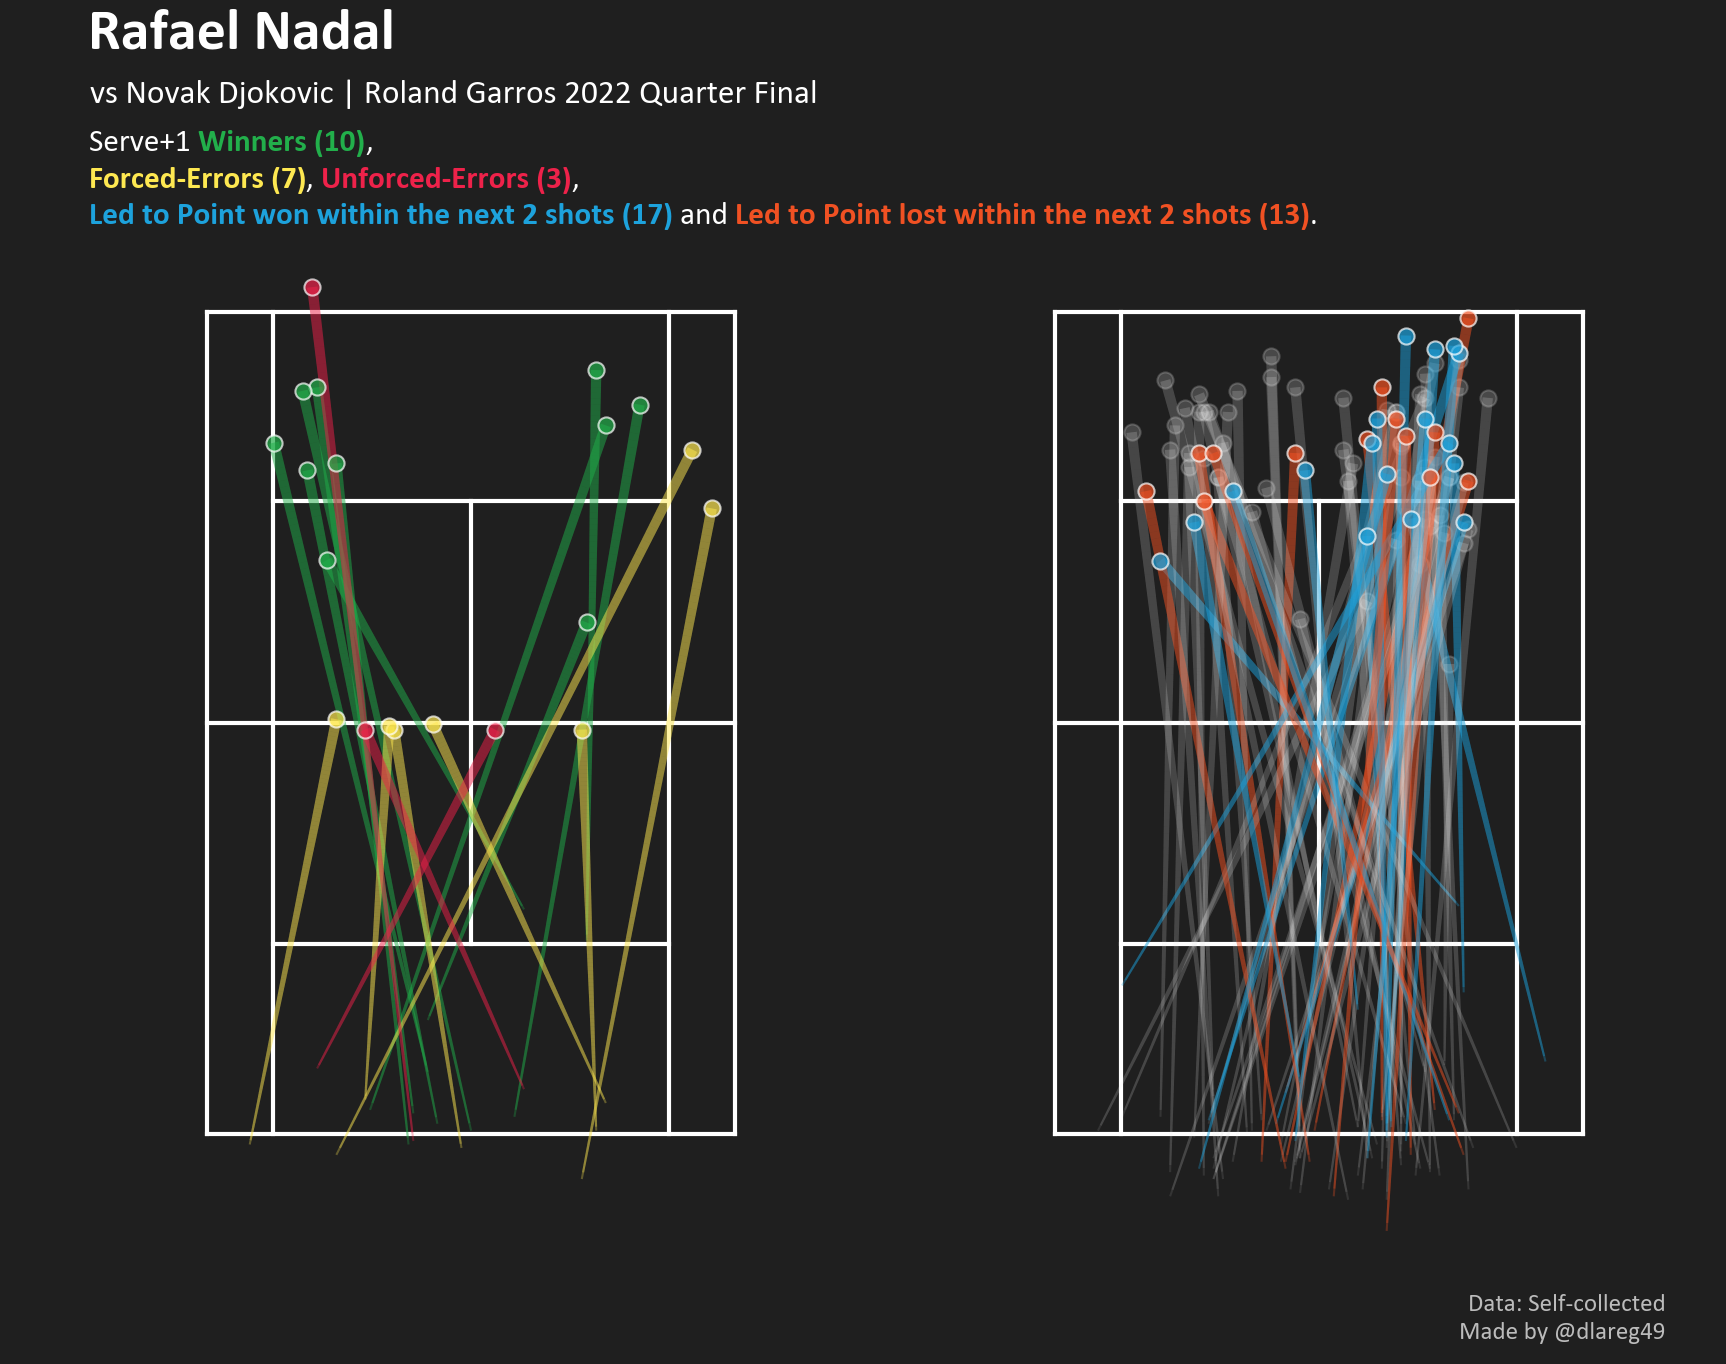
3. Serve+1 Success
In his match report, Jack Edward (i.e. On The Line Tennis) had disproved Goran Ivanisevic’s (Djokovic’s coach) odd post-match reflection about how the cooler night conditions hampered Djokovic’s ability to win free points with his serve. To add to this point, we observe from the graphic below that Djokovic’s serve did give him the upper hand in the subsequent “+1” shot department.
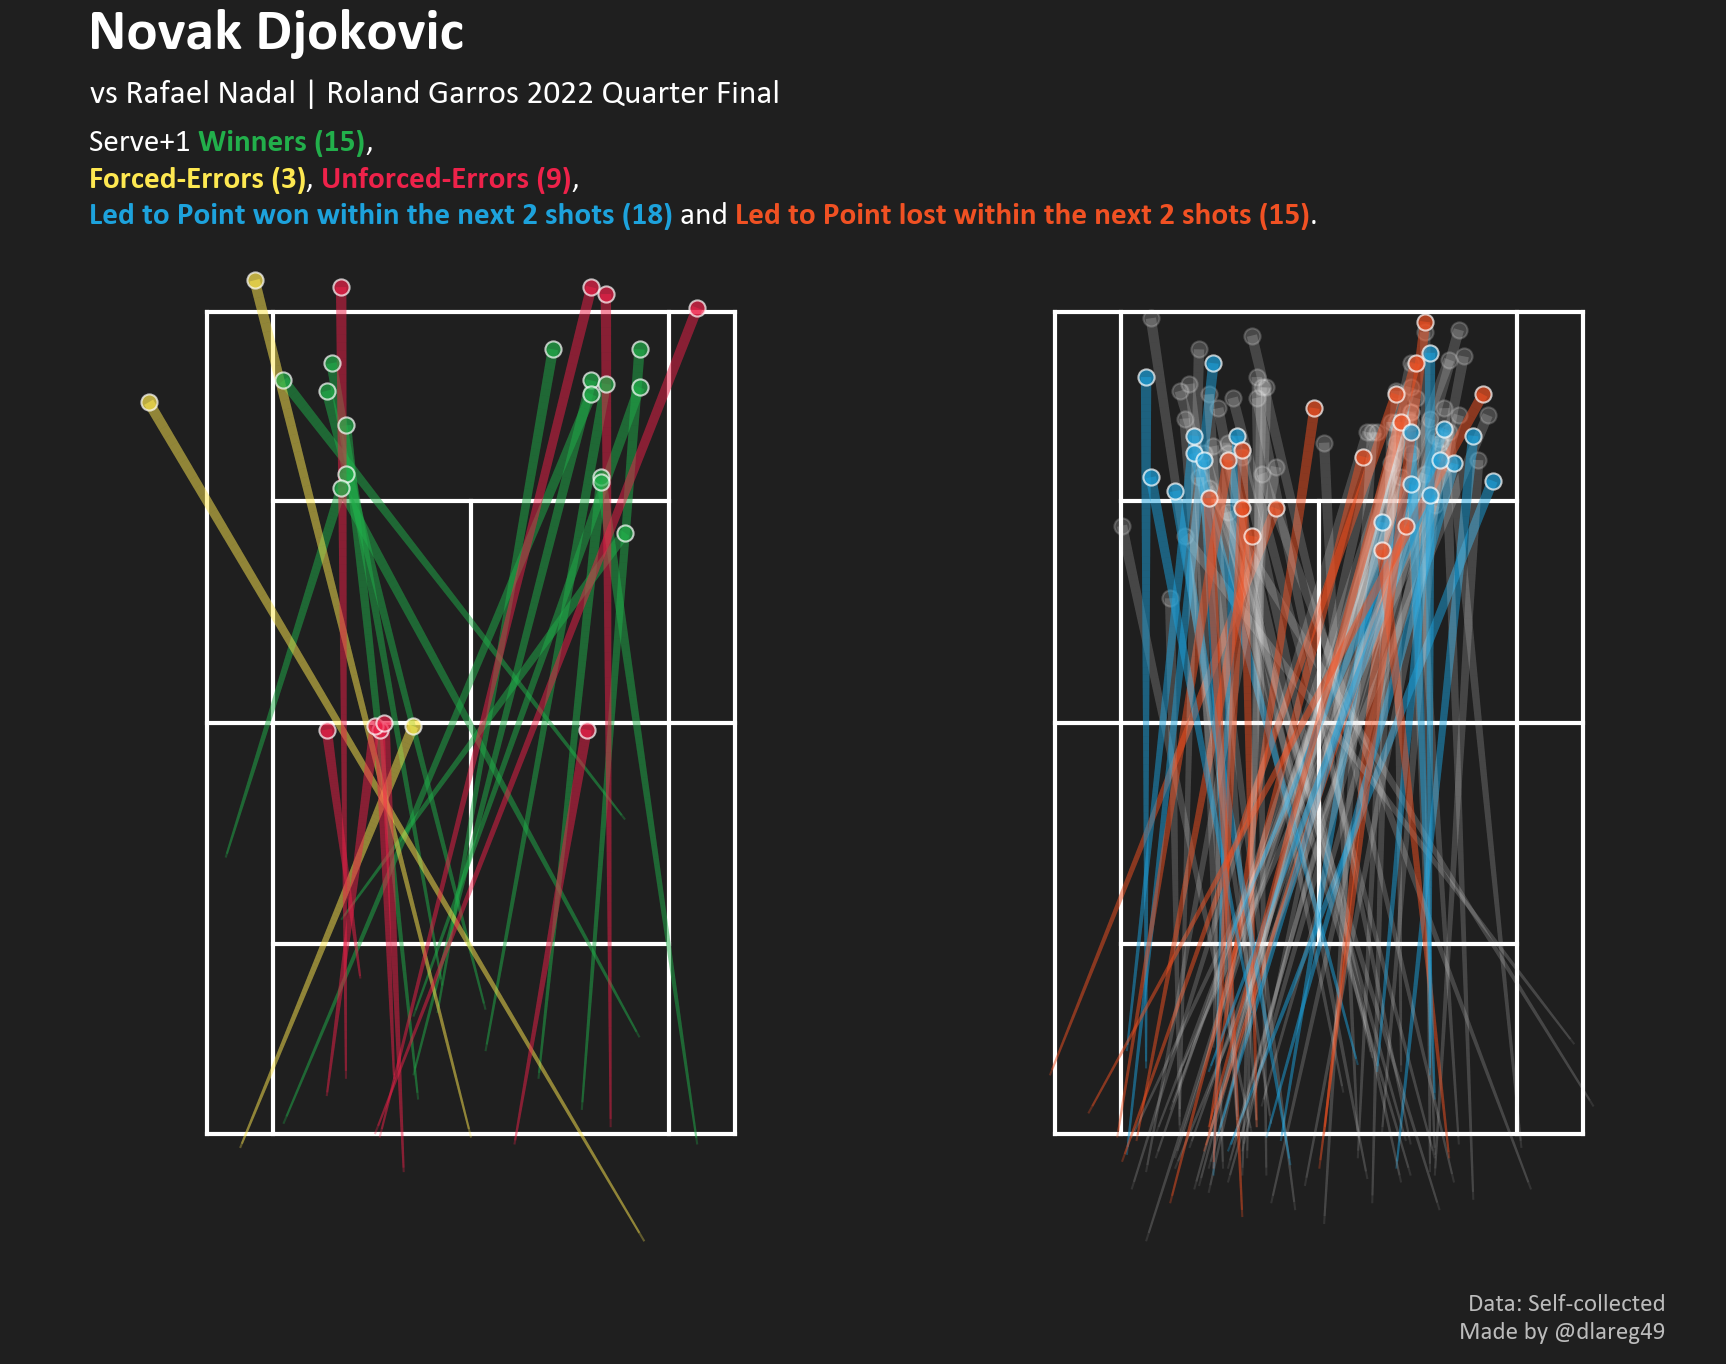
Despite spraying more unforced-errors, he compensated with 15 winners to Nadal’s 10 with his +1 shot and also ended with a +3 winner-error differential whereas Nadal finished with 0. There is also an interesting split in fortunes between +1 shots which he managed to guide closer to the singles sidelines vs those that ended closer down the middle. In total, Djokovic hit a +1 shot 120 times compared to Nadal’s 108, and managed to win 27.5% of them within 3 shots to Nadal’s 25%. Perhaps Goran was expecting a lot more?
4. Rafa locks Novak in Backhand-side Jail
For a game plan that relies so heavily on the forehand, Nadal’s 2021 defeat was remarkable in that it was the first time in their clay rivalry where he hit more backhand groundstrokes than forehands, and also hit more backhands than Djokovic. Although Djokovic has arguably the best backhand to match up against the Nadal forehand, over the long term it still is largely a net negative to rely on these rally exchanges as a viable strategy, especially so on clay where Nadal’s topspin is at its most vicious. The heat map belows shows the breakdown of all topspin groundstroke locations (of the ball) for the two players over the backcourt and baseline areas where these shots are most commonly struck.
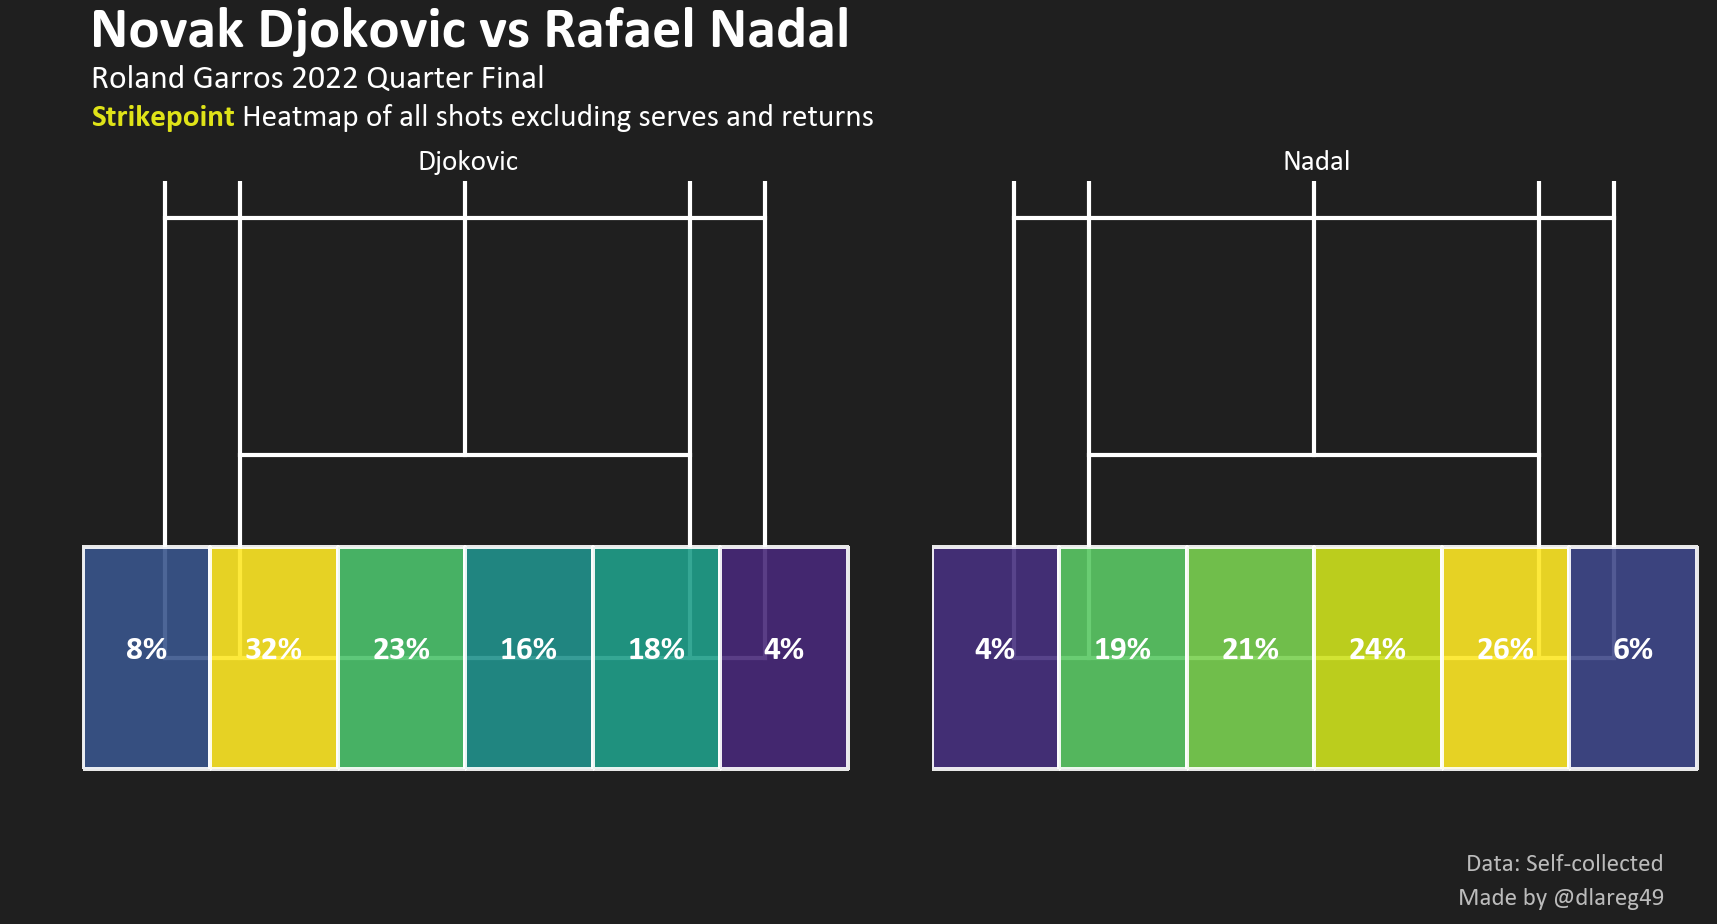
Immediately we observe that Nadal did the work to ensure that a 2021 repeat wouldn’t happen by forcing Djokovic to hit 40% of his groundstrokes from his backhand side. Successfully pinning Djokovic to this wing puts him under sustained pressure over deciding whether to continue dueling crosscourt against his forehand (which is statistically unlikely to break down on clay) or, opt for the lower percentage down the line shot which, if it lands short, probably concedes a putaway inside-out shot from Nadal.
5. Contrasting Backhand Fortunes
Continuing the theme of the forehand-backhand pendulum, we take a look at how Djokovic statistically performed with his backhand topspin groundstrokes once engaged into a rally (we already know it wasn’t great, given that we just saw how he wasn’t able to gain ground away from the backhand side).
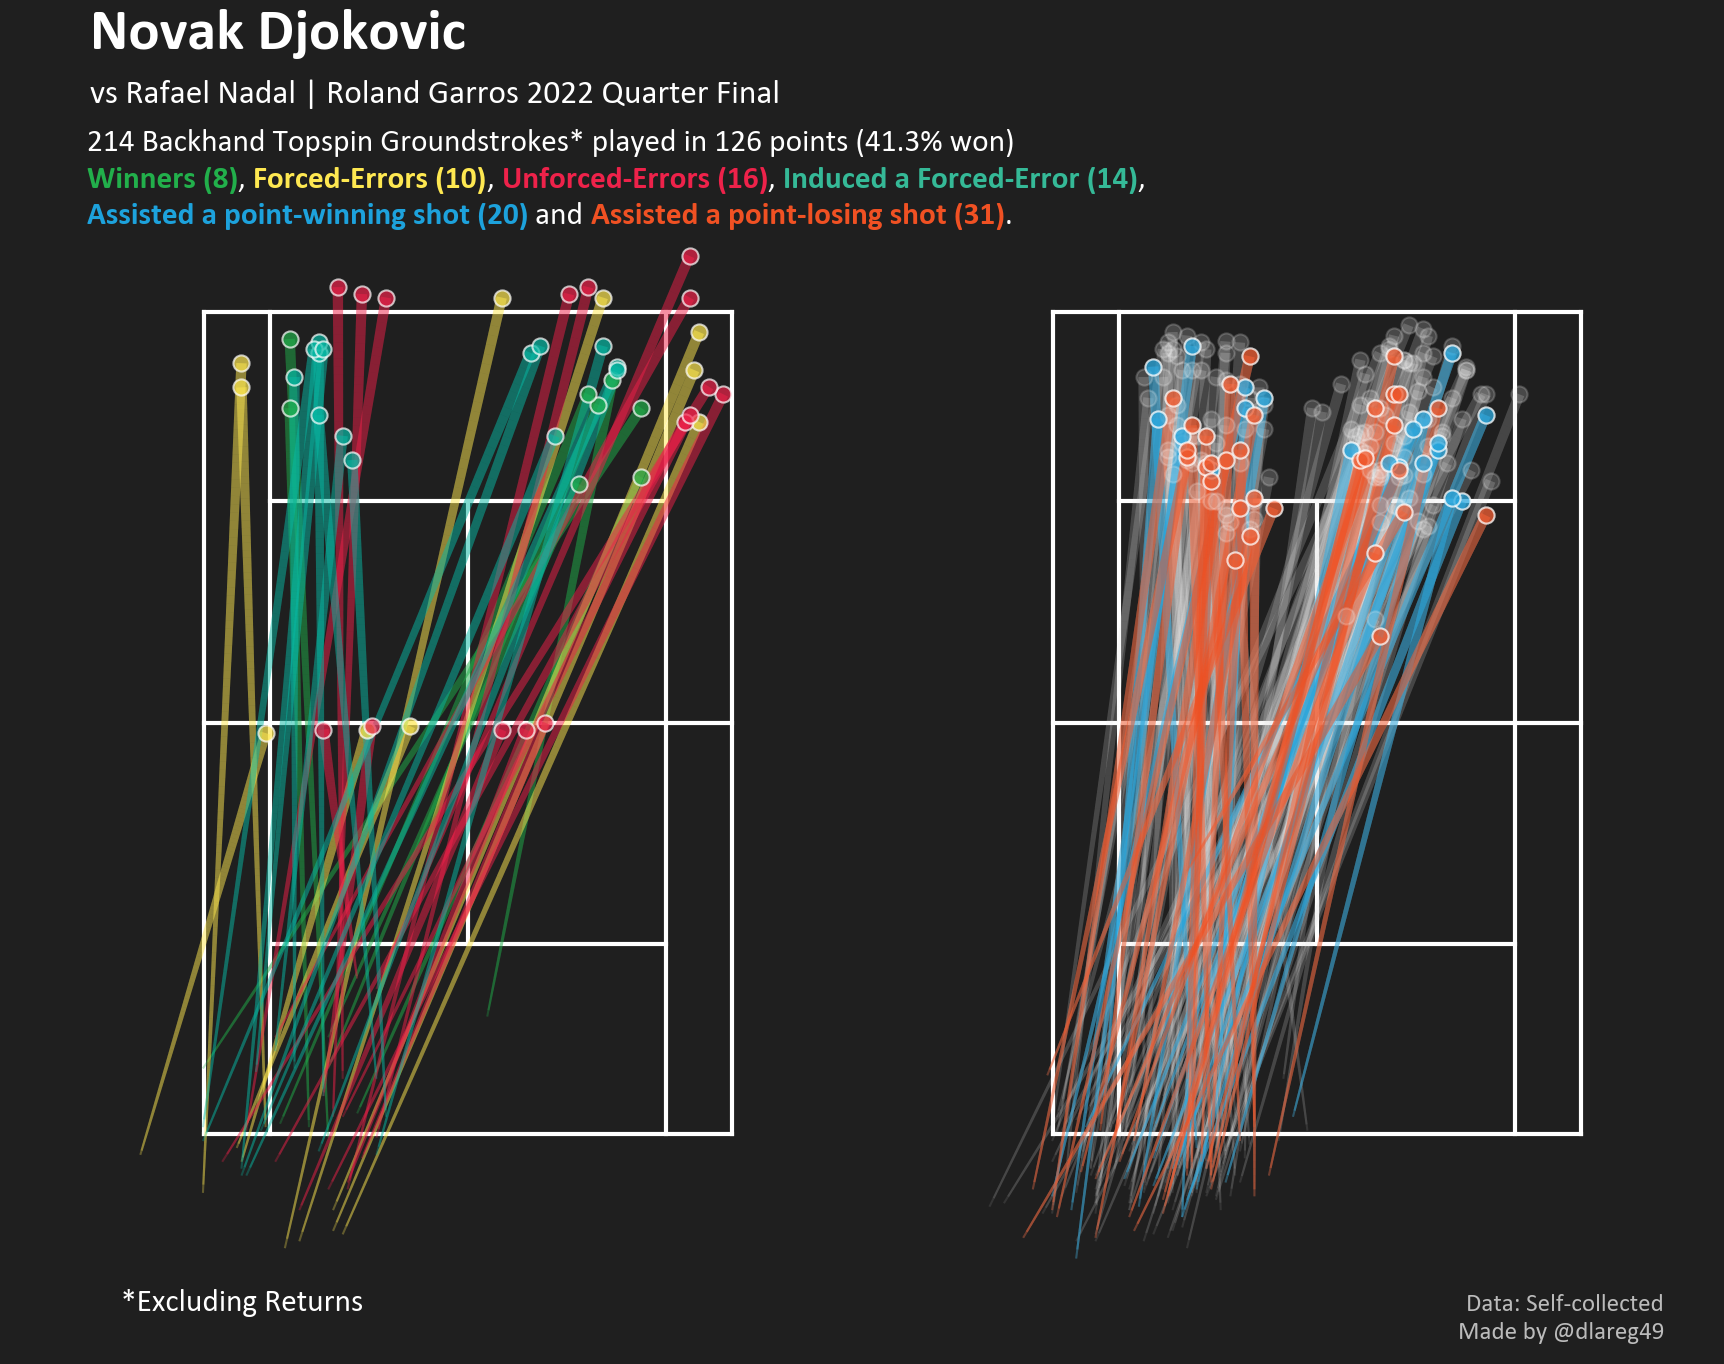
This shot map is probably the first mention of “Assists” in this article. While not “proper” terminology in tennis, they’re defined here similar to how they are in football i.e. the goal “minus 1” pass! E.g. a point-winning assist would be a shot that set up a winner on the same player’s next shot, or set up a shot that induced an error (both forced and unforced) from the opponent. Apply the same logic to the point-losing ones.
Excluding service returns, Djokovic played 214 backhand topspin groundstrokes versus Nadal’s 177. Even factoring in points won via errors immediately forced by his backhand, he is still a 22-26 = -4 in the “winners”-error count. Uncharacteristic unforced errors were sprayed down both wings and even when his stroke did not immediately end the point, more often than not did they hand the initiative back to Nadal for a winner or error-forcing shot of his own.
Contrary to what happened last year, Nadal’s backhand held firm throughout as he was able to repel Djokovic’s attempts to corner him in this wing.
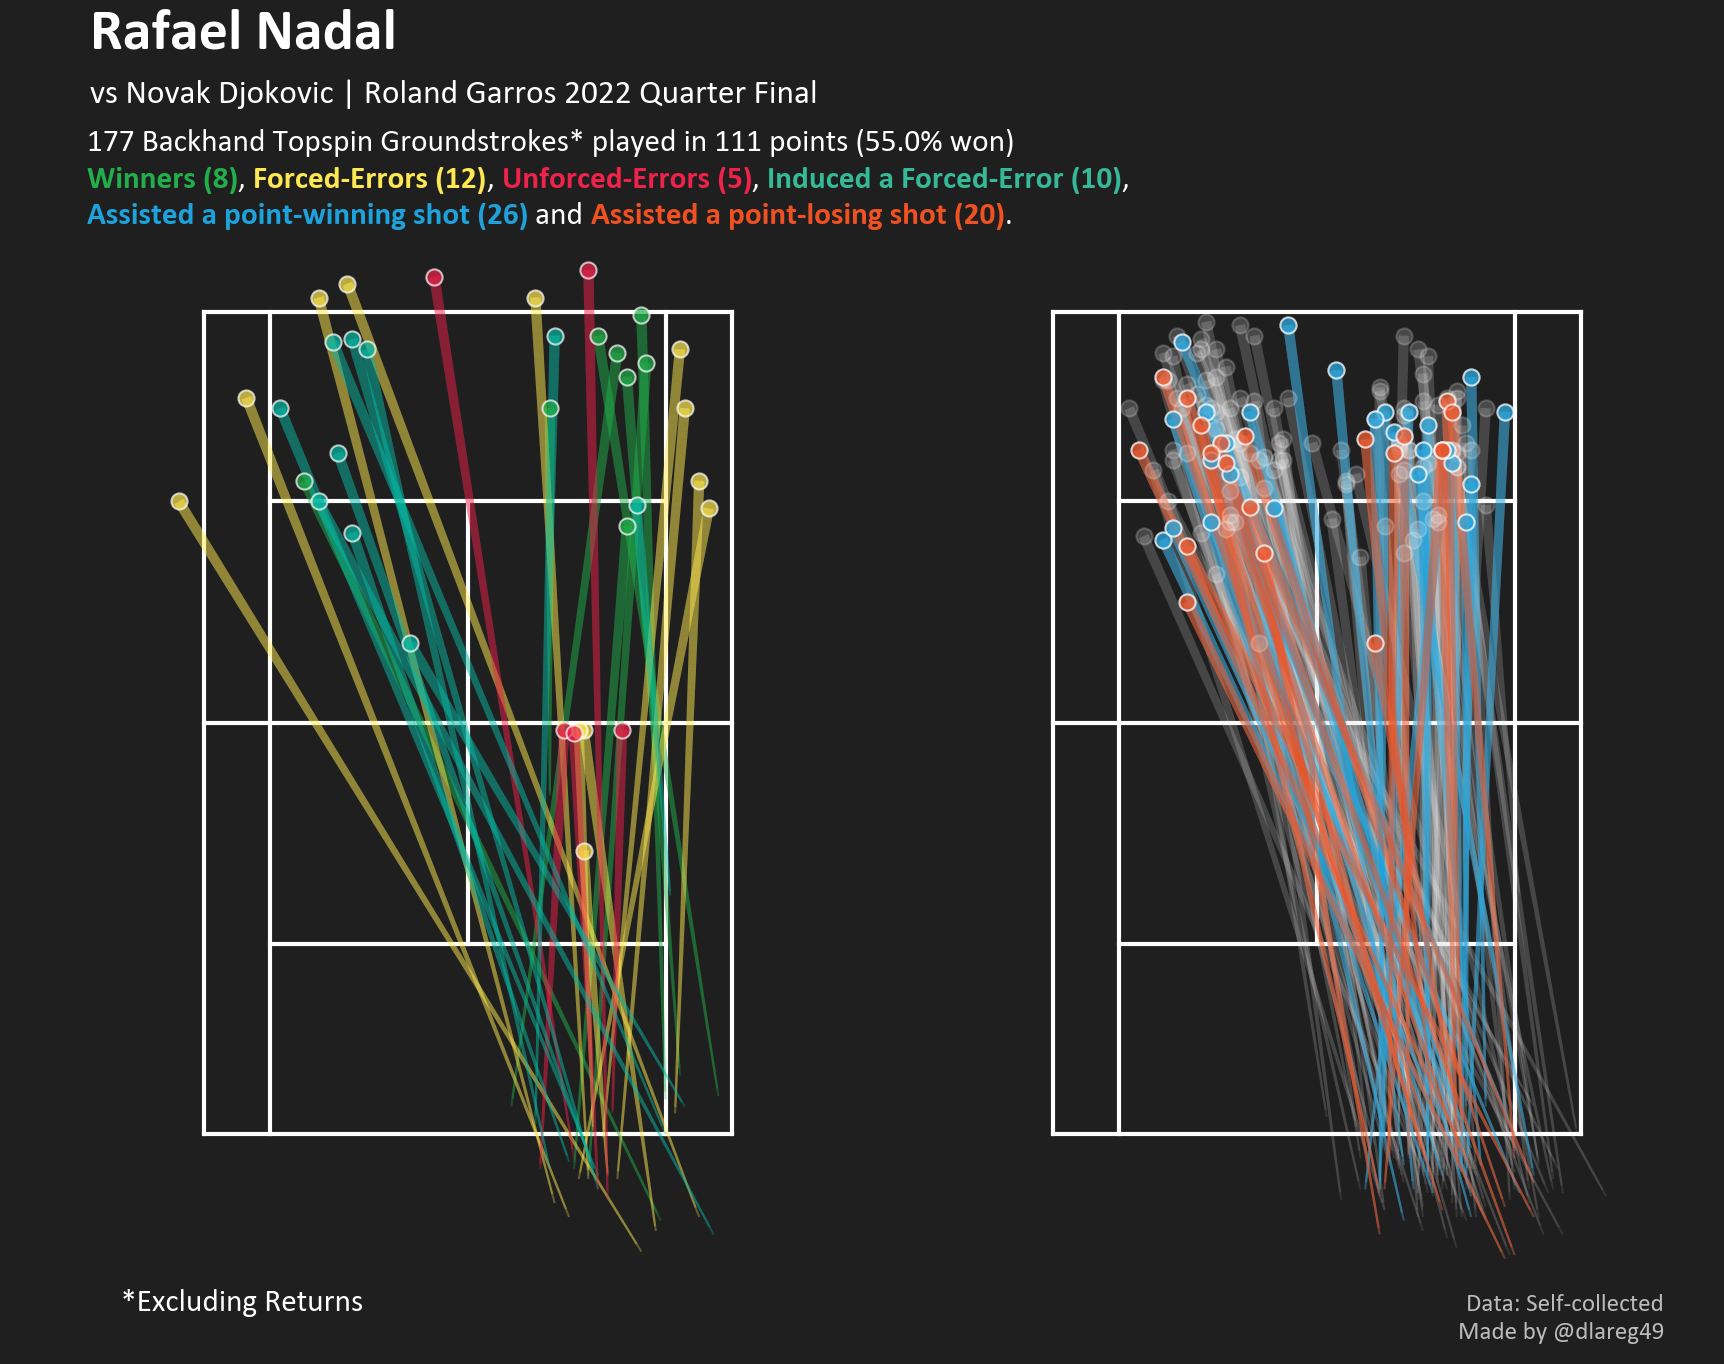
His 17 errors in total were just one fewer than Djokovic’s unforced error count. Jack pointed out in his article that Nadal only followed a Djokovic forehand cross-court with his own backhand cross-court 8% of the time, down from 29% in 2021. We see in his backhand topspin shot map below that he achieved a fairly even split between backhands sent cross-court and down the line. He even enjoyed more positive point-ending success from his down the line shots as evidenced by his winners, induced forced-errors and assists count. Lastly, his backhand shot map also depicts the baseline dominance that he was able to attain, with an average backhand strike location of 2.81 meters (horizontally) from the center compared to 3.37 meters for Djokovic.
6. Djokovic fails to get Forehand angle, Nadal unleashes Down the Line
Sharp-angled cross-court forehands were the bread and butter of Djokovic’s blueprint against Nadal last year. Needless to say, he didn’t enjoy much success with the same play this time around. The shot map below shows all of Djokovic’s topspin forehand attempts (excluding returns) that landed within the highlighted bounding box and hence, were classified under the aforementioned shot category.
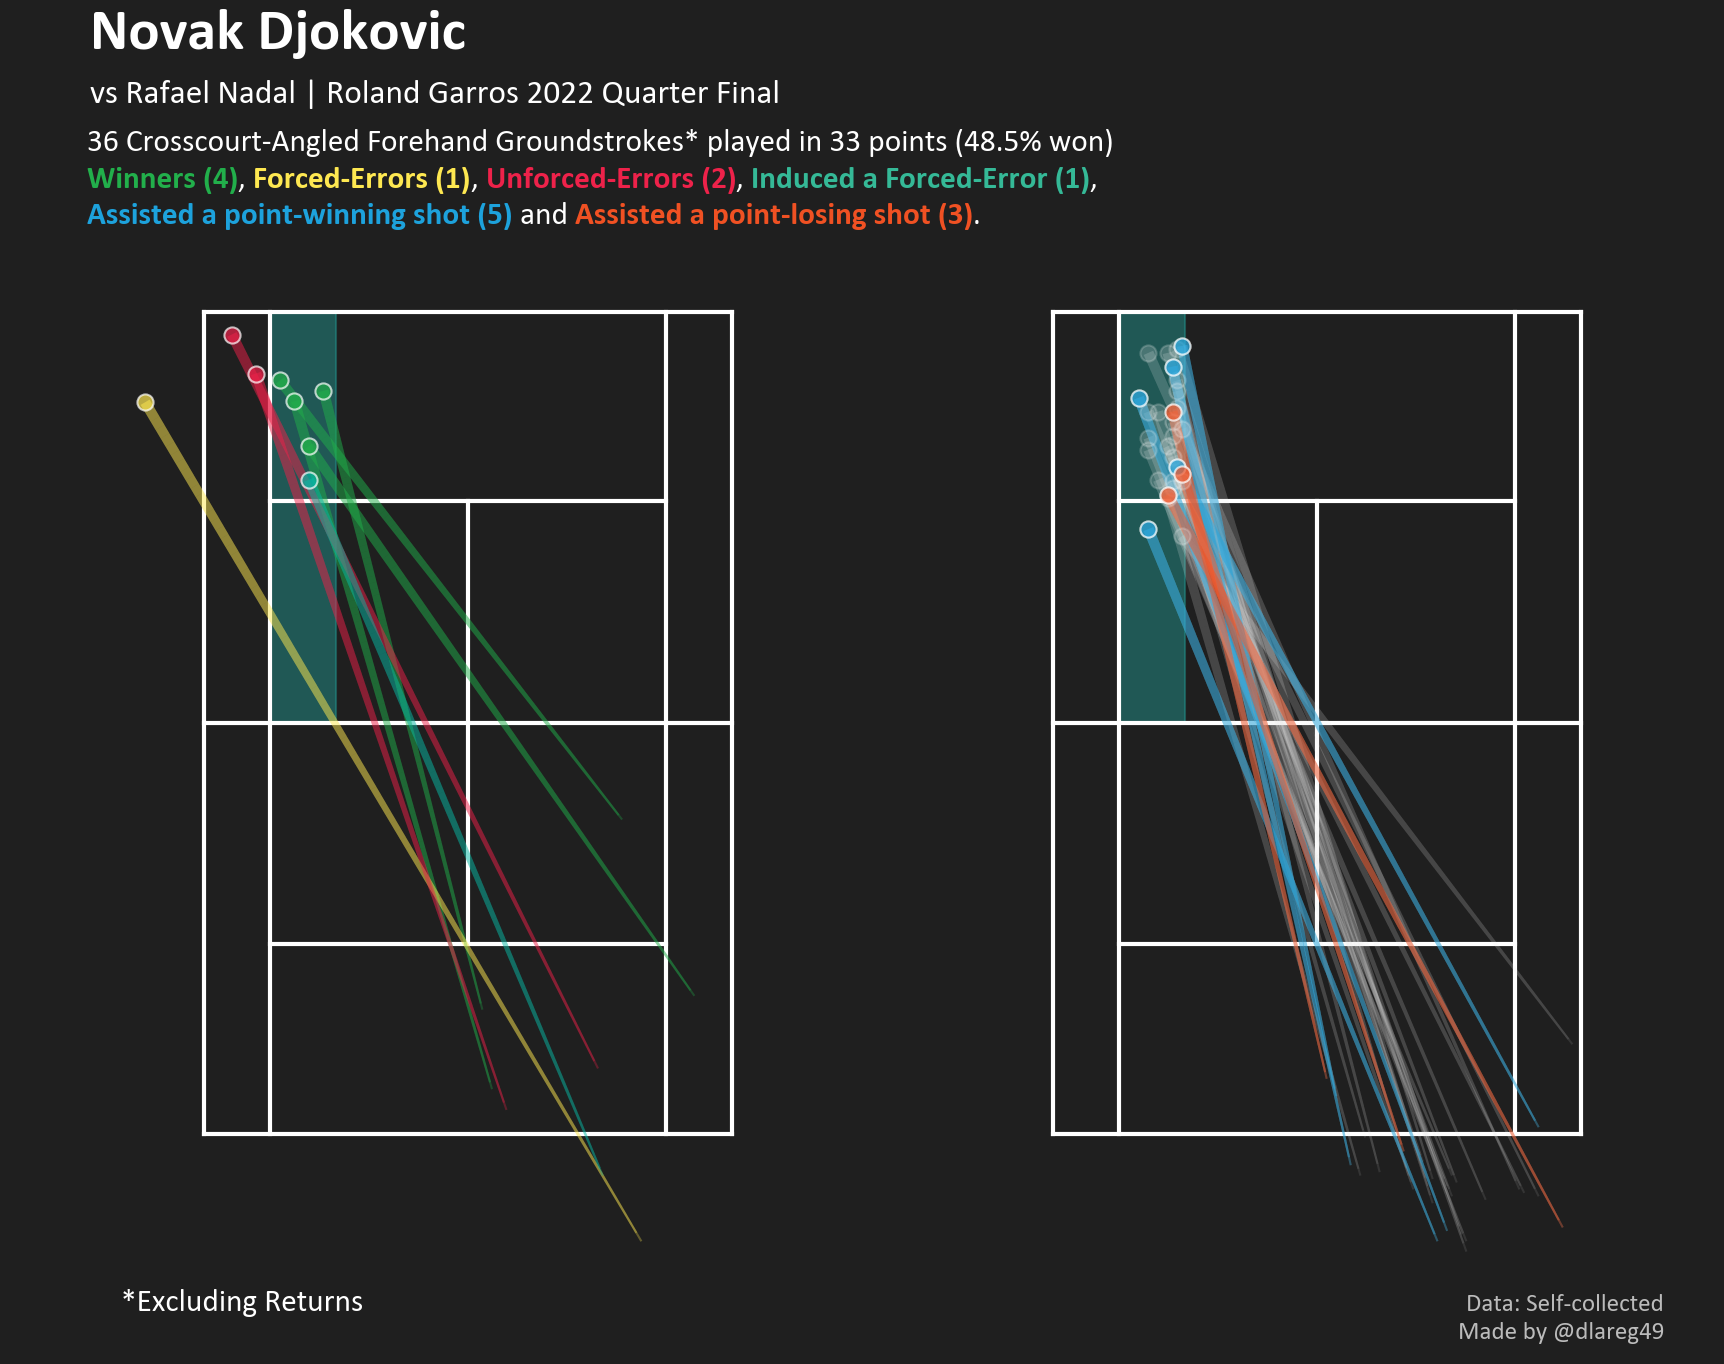
While he was positive on winners-errors and won-lost assists, he only managed to find these spots in 33 points, of which he won just 48.5%. Besides an inability to execute, the plan was also hampered by Nadal’s previously discussed insistence at minimising consecutive cross-court exchanges with his backhand.
Djokovic only managed to play this shot more than once within a point on two occasions, forcing an error on the first and then commiting a trademark Djokosmash on the second.
Often cited as a barometer of Nadal’s confidence, the inside-out and down the line forehand may not have been as frequent or devastating in the past (see 2014), but was still executed to great effectiveness when the court opened up for him.
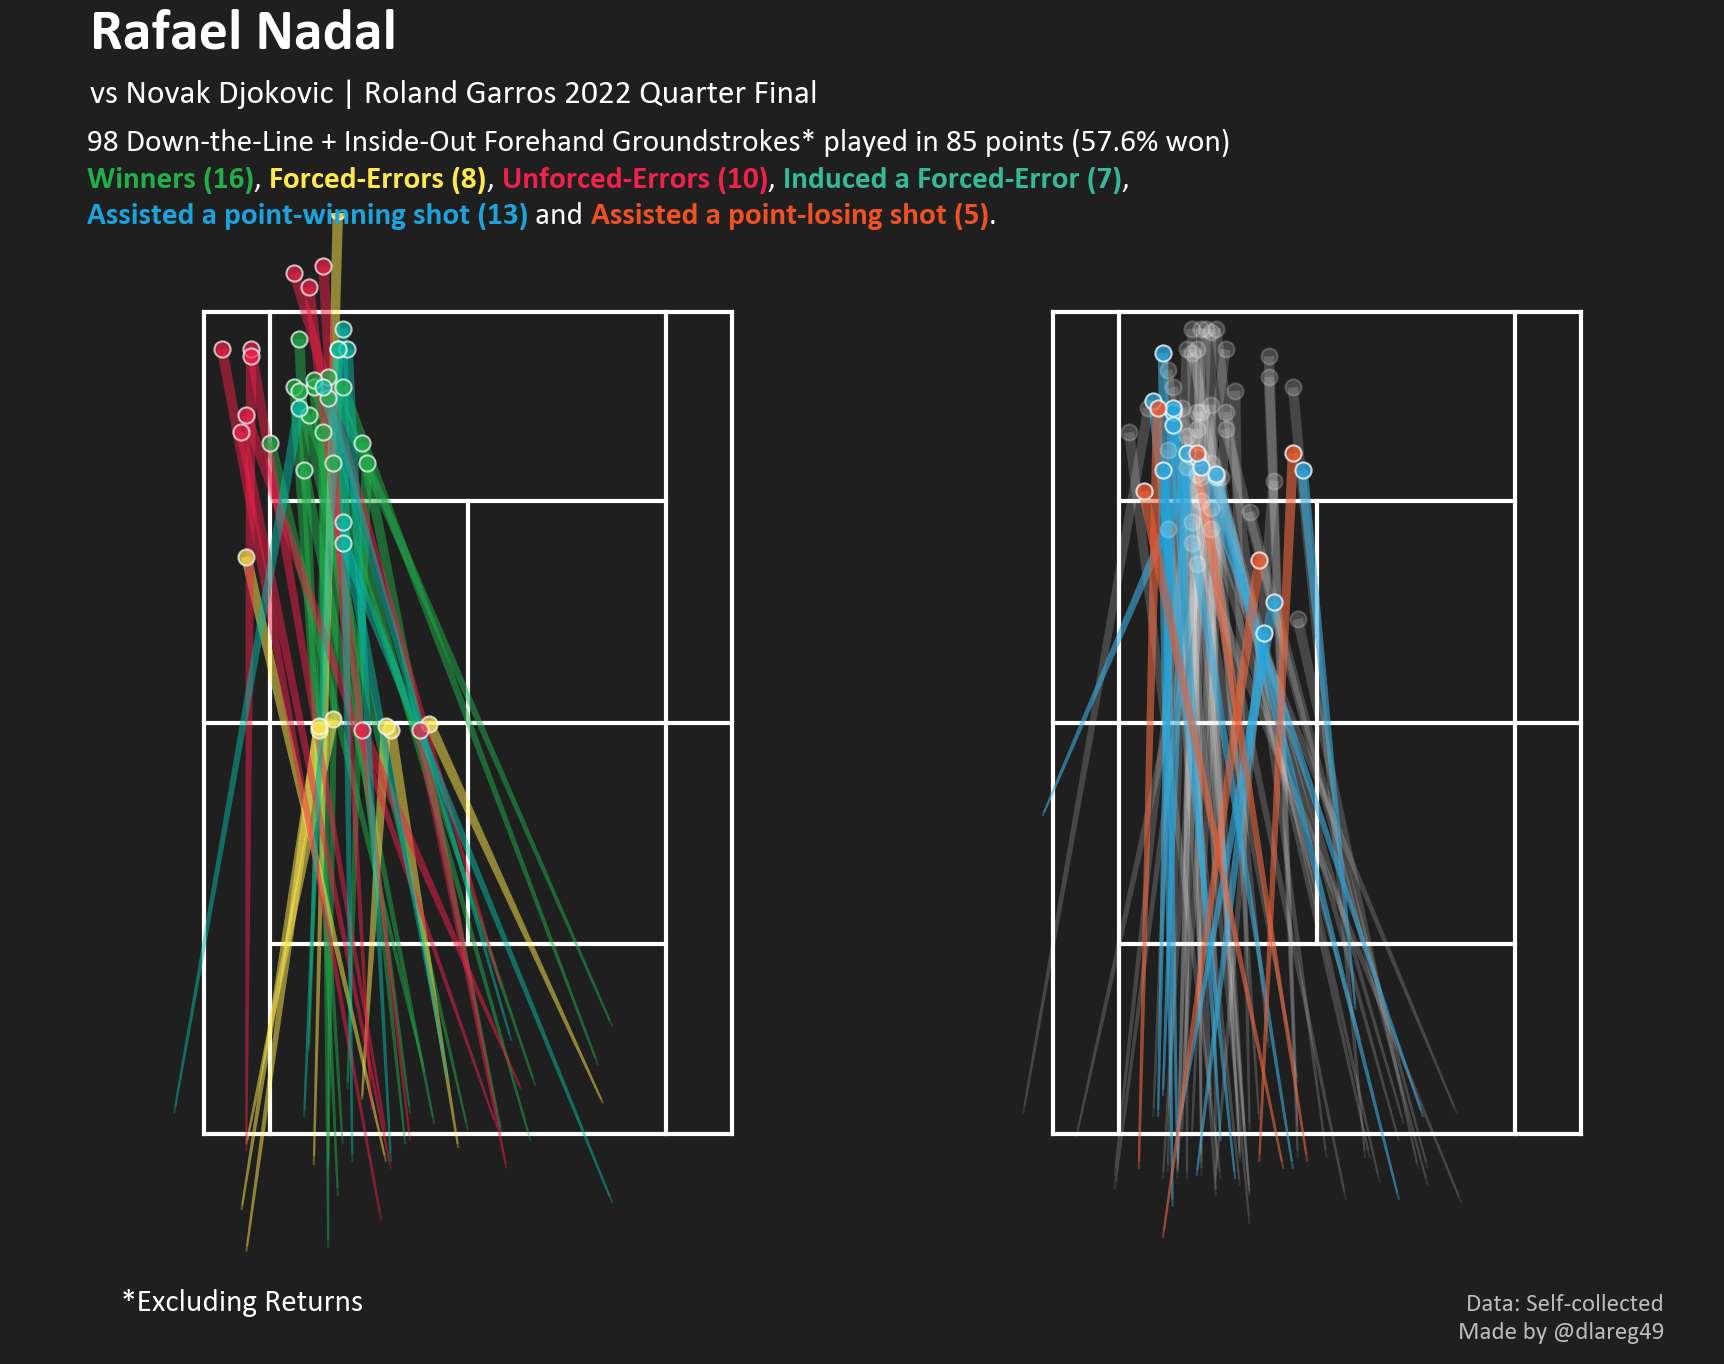
A couple of devastating 1-2 punches here to add to the many that Djokovic has been on the receiving end of over his career. Vintage.
7. Djokovic’s Dropshot Disappointment
The backhand drop-shot has evolved over time into a formidable weapon in Djokovic’s arsenal, featuring in several all-time clutch points which have pushed his case as the mental GOAT - just see this crucial set point save from last year’s encounter.
Perhaps the lack of big match experience over the past 9 months can be blamed, as Djokovic’s touch deserted him that night and won him just 5 of his 13 initiated duels.
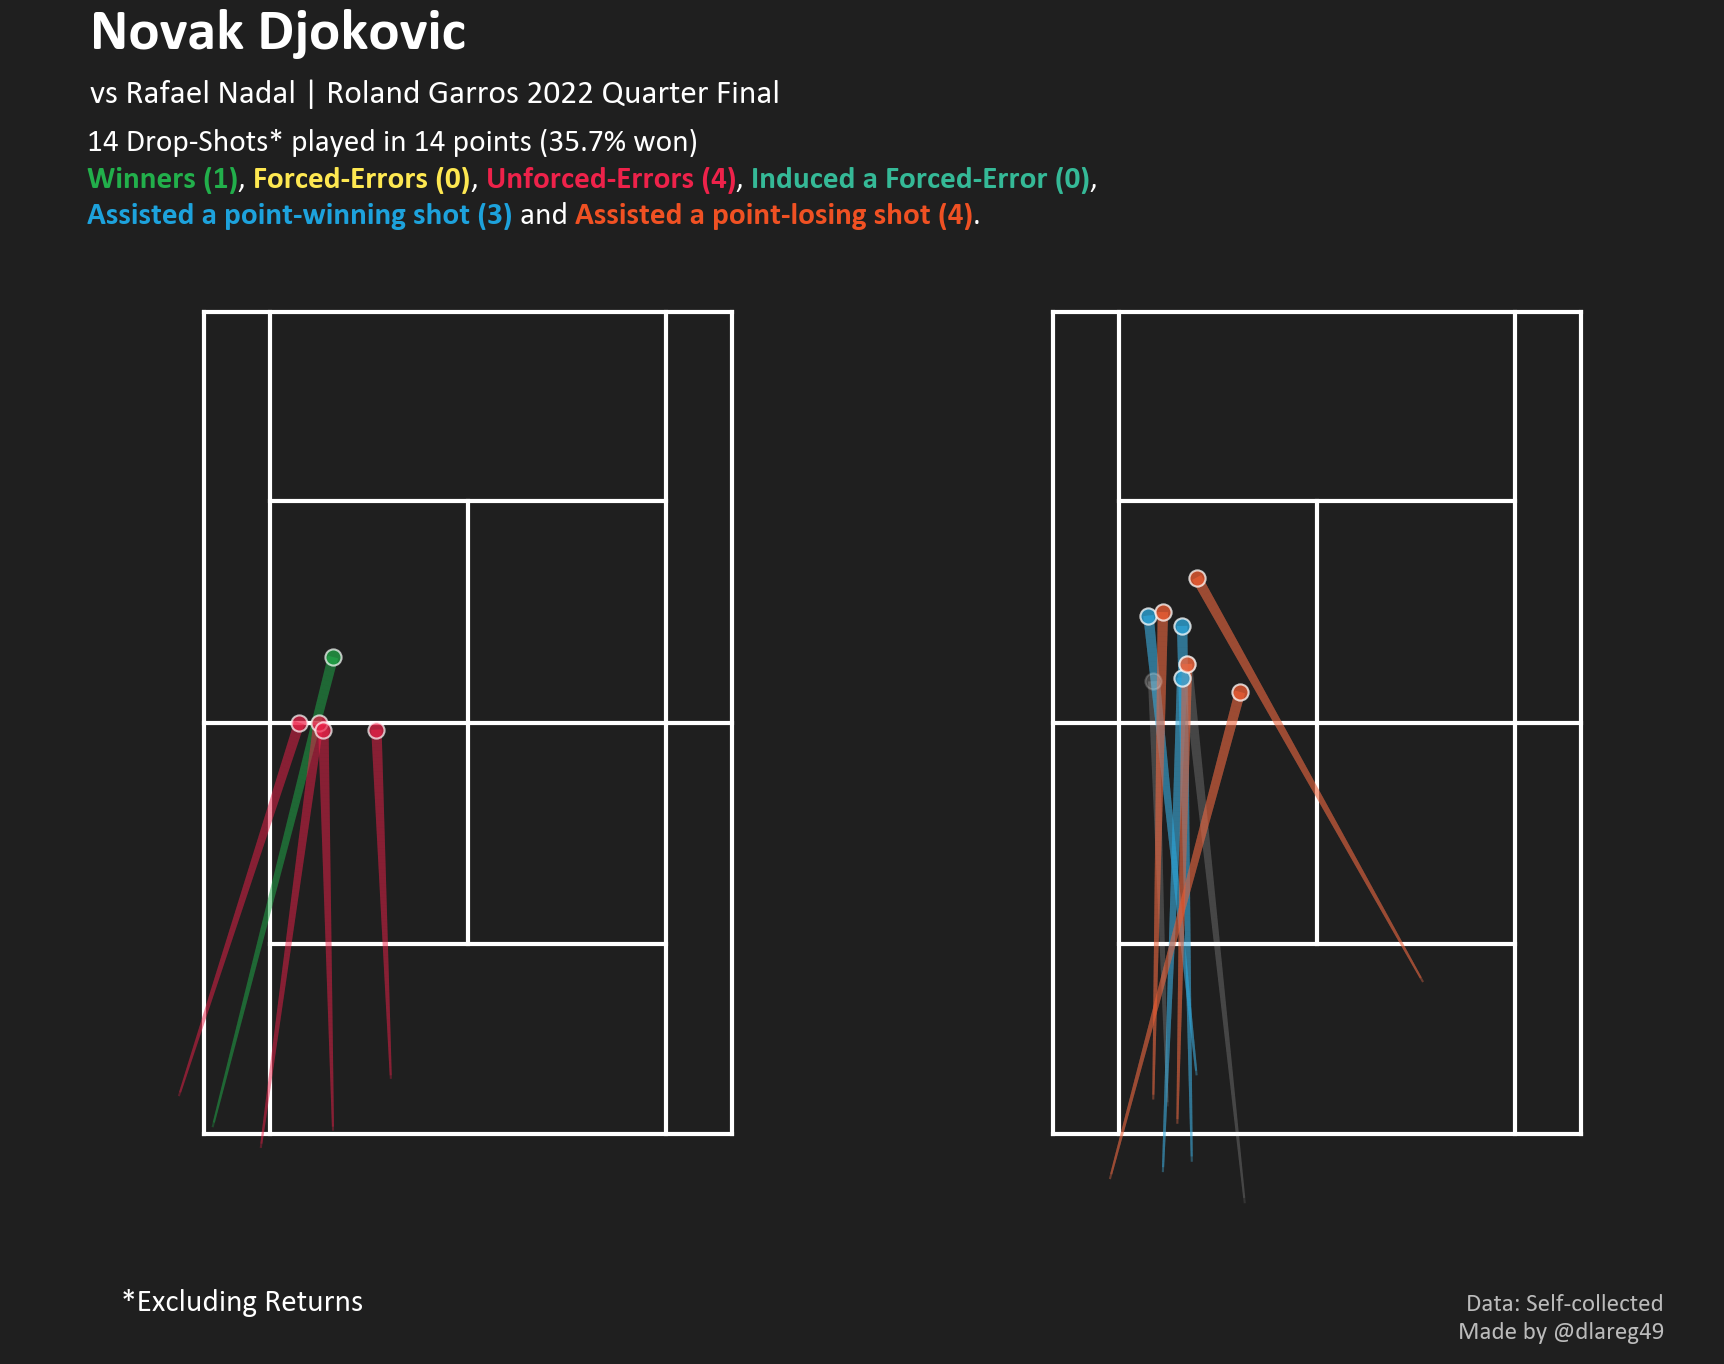
The most offending attempt, came at an important juncture during the fourth set tie break. If last year’s effort felt like a spellbinding trick, this one felt almost like a pitiful plea towards Nadal to put him out of his misery.
8. Slice Claydal at your peril
Ah the slice - the shot that I only bothered to start learning properly 20 years after I first picked up a racket. While Nadal did lose more points in which the backhand slice was deployed than win, it was still a relatively healthy ratio considering that he often plays them during the neutral/defensive phase. A good number of them accomplished the desired depth down the line to help him reverse the tide of the point and win it eventually.
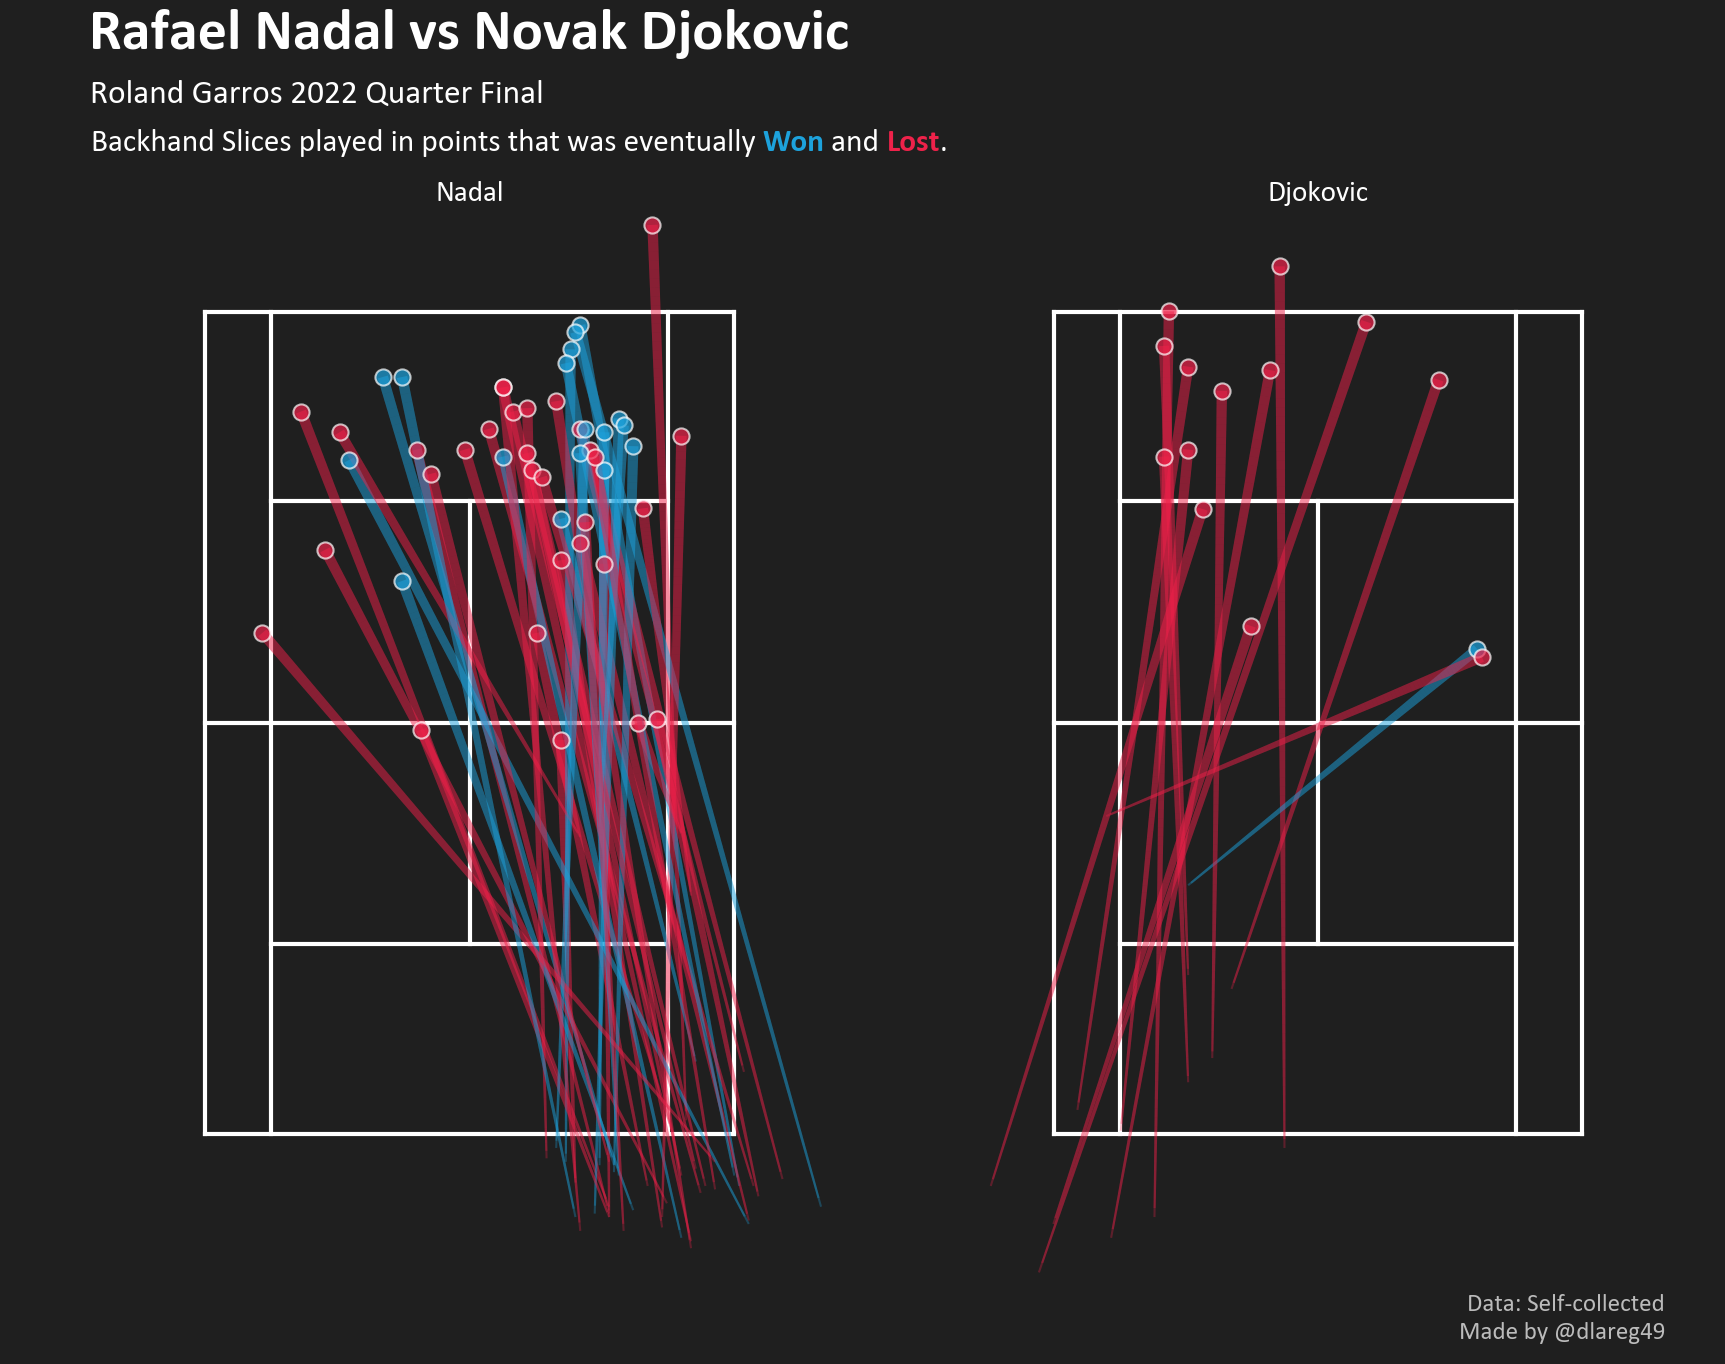
Slicing against Nadal on clay however, is rarely ever a great idea, for there is probably no better player at delivering a RPM-switcheroo and gobbling up a slice on the dirt - just ask a certain Roger Federer. Djokovic’s backhand slice has improved over the years to become a valuable asset especially on surfaces such as grass, but in his last 5 meetings with Nadal on clay, he only won 31% of points in which he played the shot (the 2021 semi final is again an anomaly, where he won 4/5 of these exchanges). The 2022 meeting was an extreme regression past the norm, as he lost 13 out of 14 such exchanges here. Just watch the gif below for an example of what tended to happen.
That single point that he won from a backhand slice? Amusingly that was actually a winner from the forecourt. In fact, Tennis Abstract didn’t even log that shot as one, hence his backhand slice success rate stands at 0% on their site.
9. Pressure Plays
Scorelines between these two on clay can flatter to deceive - look no further than their 2020 Roland Garros final, which began with the “most competitive ever” 6-0 set to Nadal which lasted an absurd 45 minutes. Break points will be plentiful on this surface and how one handles the pressure can draw the fine line between victory, defeat or even a scoreboard trashing. On this night, Djokovic saved 10/17 of his break points faced whereas Nadal saved 8/12. In the tiebreak, where every point is essentially a break point, Nadal won 1 more point off Djokovic’s serve than vice versa to clinch it 7-4.
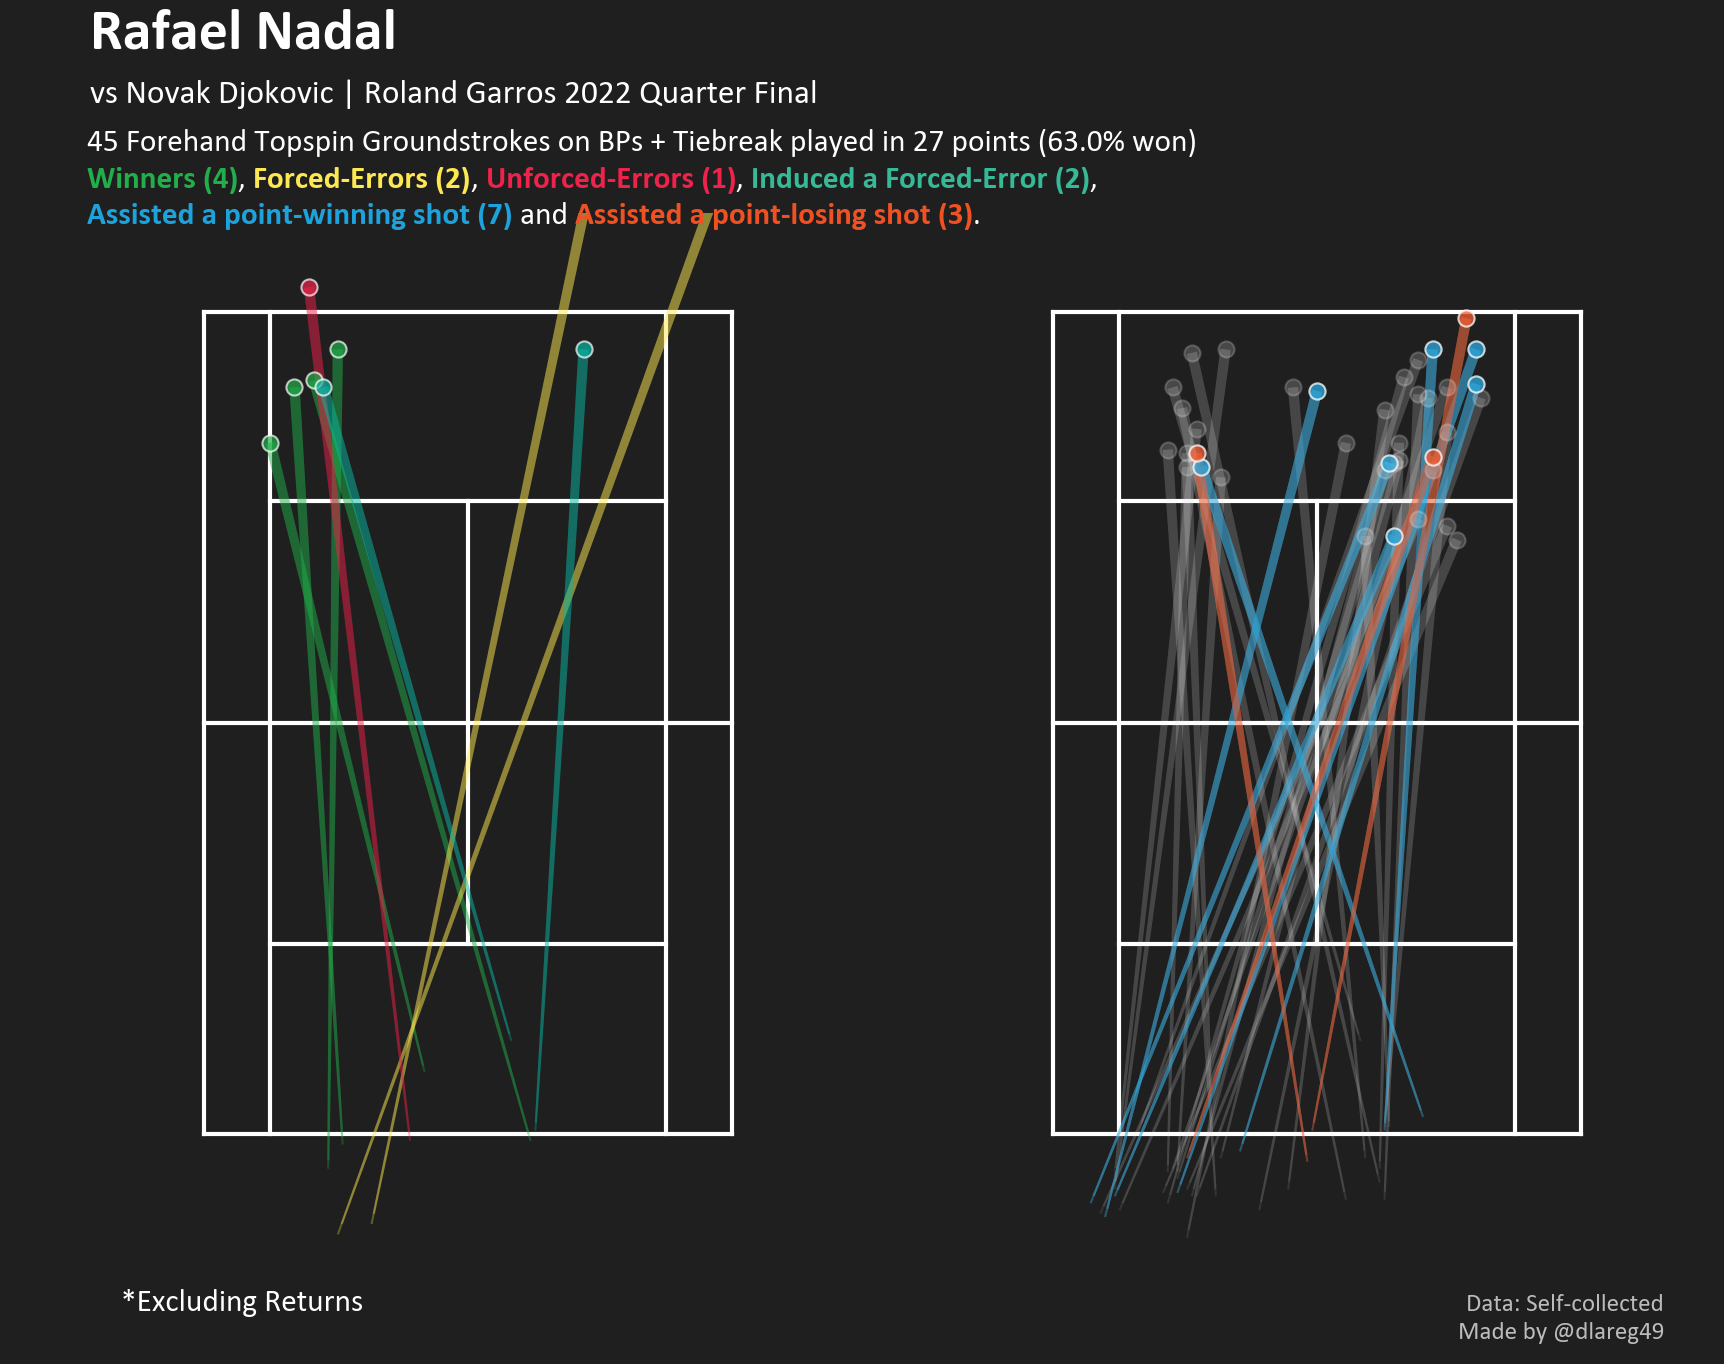
This analysis is extended by analysing how each player hit on these so-called pressure points (i.e. their breakpoints faced + tiebreak points) with their forehand topspin groundstrokes (excluding returns).
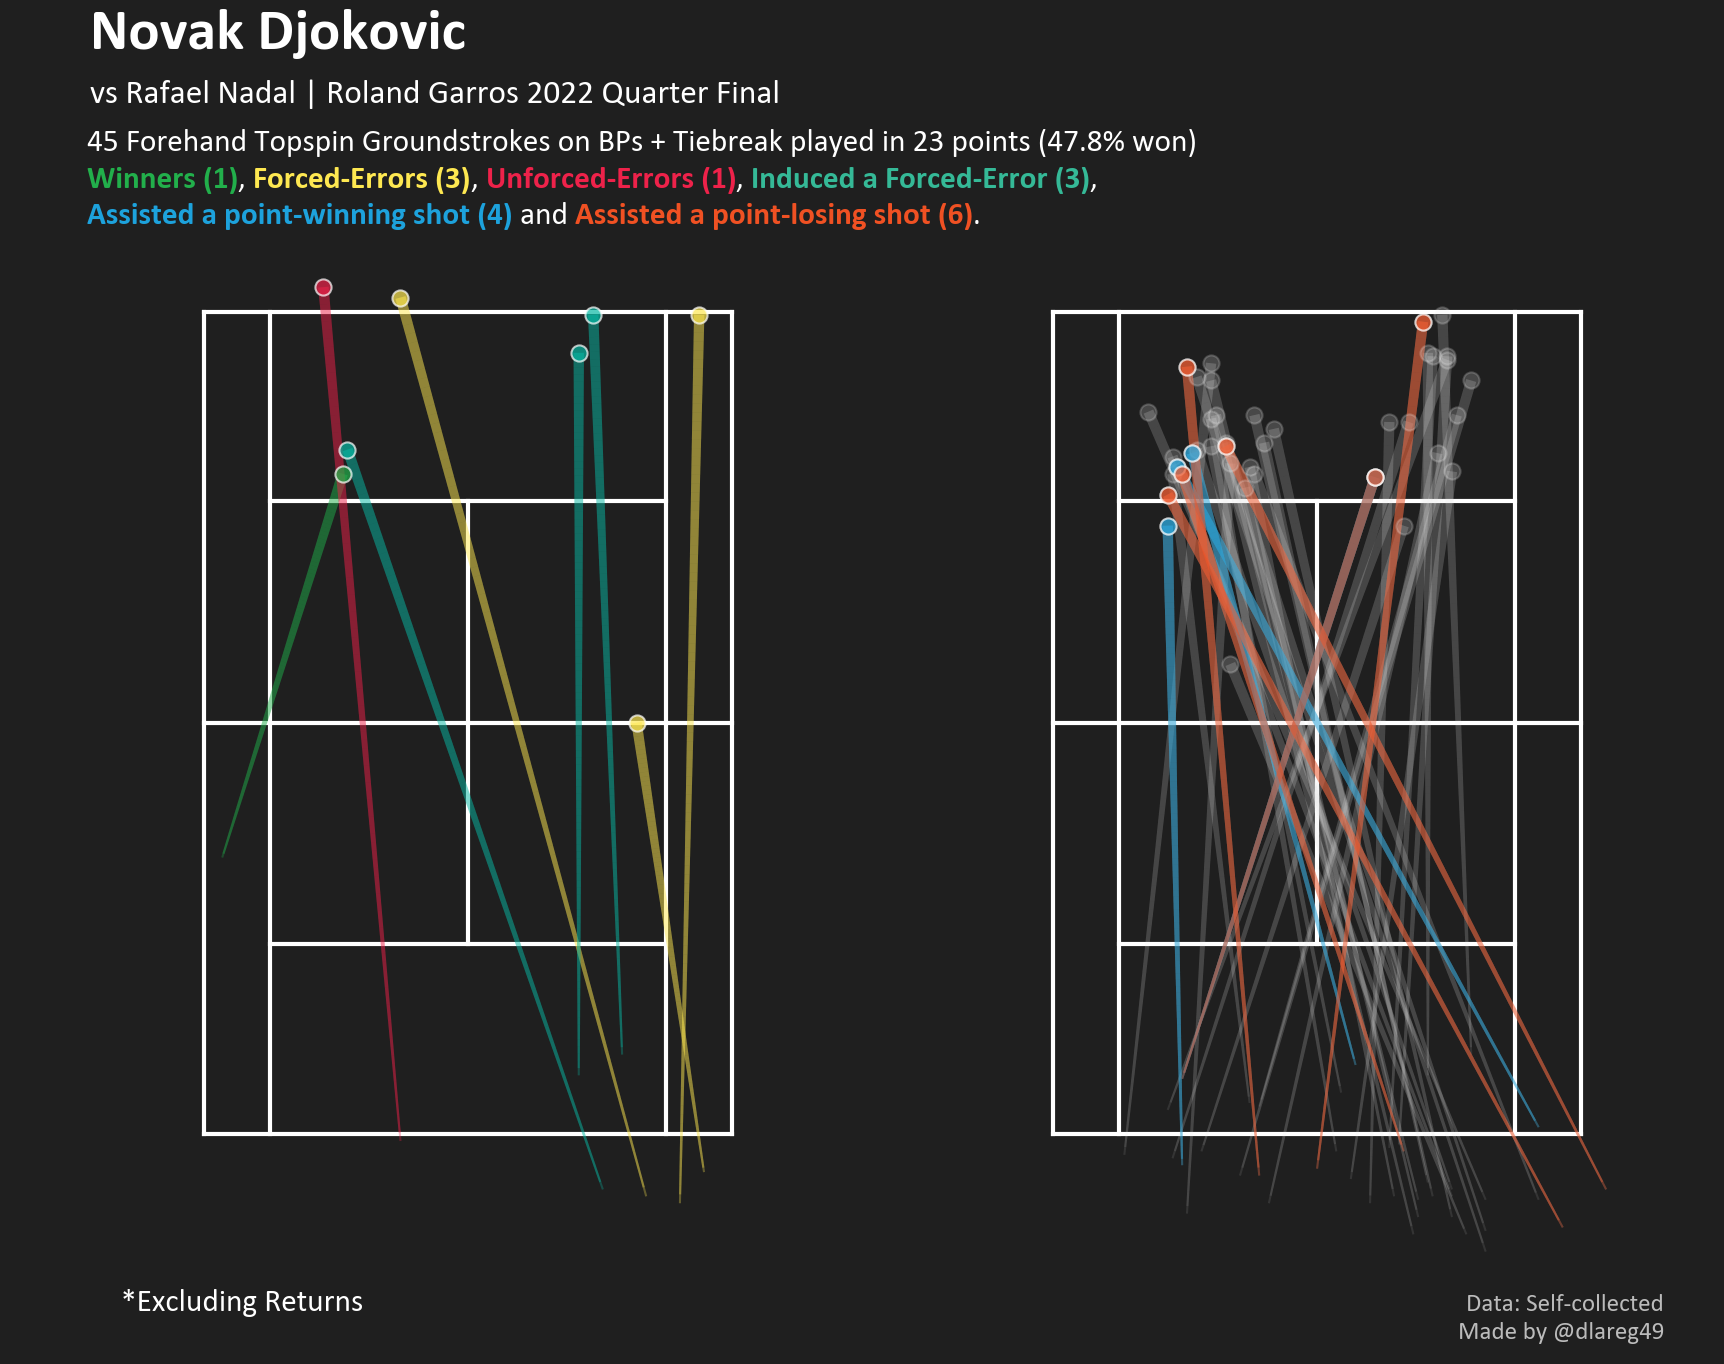
Djokovic only hit one outright forehand winner and was rather unsuccessful at getting much depth on his cross-court shots during these moments. Contrastingly Nadal’s cross-court forehands clicked for him under pressure, giving him 5 assists, 2 of which led to forehand down the line winners.
10. Counterpunching Classico
For my last point I attempted to examine both player’s abilities to turn defence into attack by deriving these occurrences from the recorded positional data. First, I employed a set of rules to filter out rally shots that can be classified as being in the attack phase.
- Consider only rally shots (i.e. not serves or returns )
- The shot is one of the following types: Topspin, Swing-volley, Volley, Overhead
- The shot took place from no further than 0.5 m behind the baseline.
- The shot did not follow a drop-shot.
- The shot must not have a forced-error outcome.
- Any groundstroke must have took place at least 1 m (y-distance) from the preceding shot’s bounce point (this is to filter out strokes hit inside the baseline as a result of being caught of position i.e. no man’s land)
Note: The “0.5 m behind the baseline” threshold is somewhat naive and not entirely representative given that Nadal generally plays from a deeper position than Djokovic. A percentile-based threshold was considered although that would also need an arbitrary cutoff and also assume both players have the same attack/neutral/defense shot spread.
Defensive shots are then simply the shot that immediately followed an attacking shot. An additional rule was then applied to the remaining shots to get the final subset.
- A defensive shot must not have an unforced-error outcome.
We see from Nadal’s defensive shot map that he managed to win 49.1% of points and even managed to hit 7 direct winners when facing this situation.
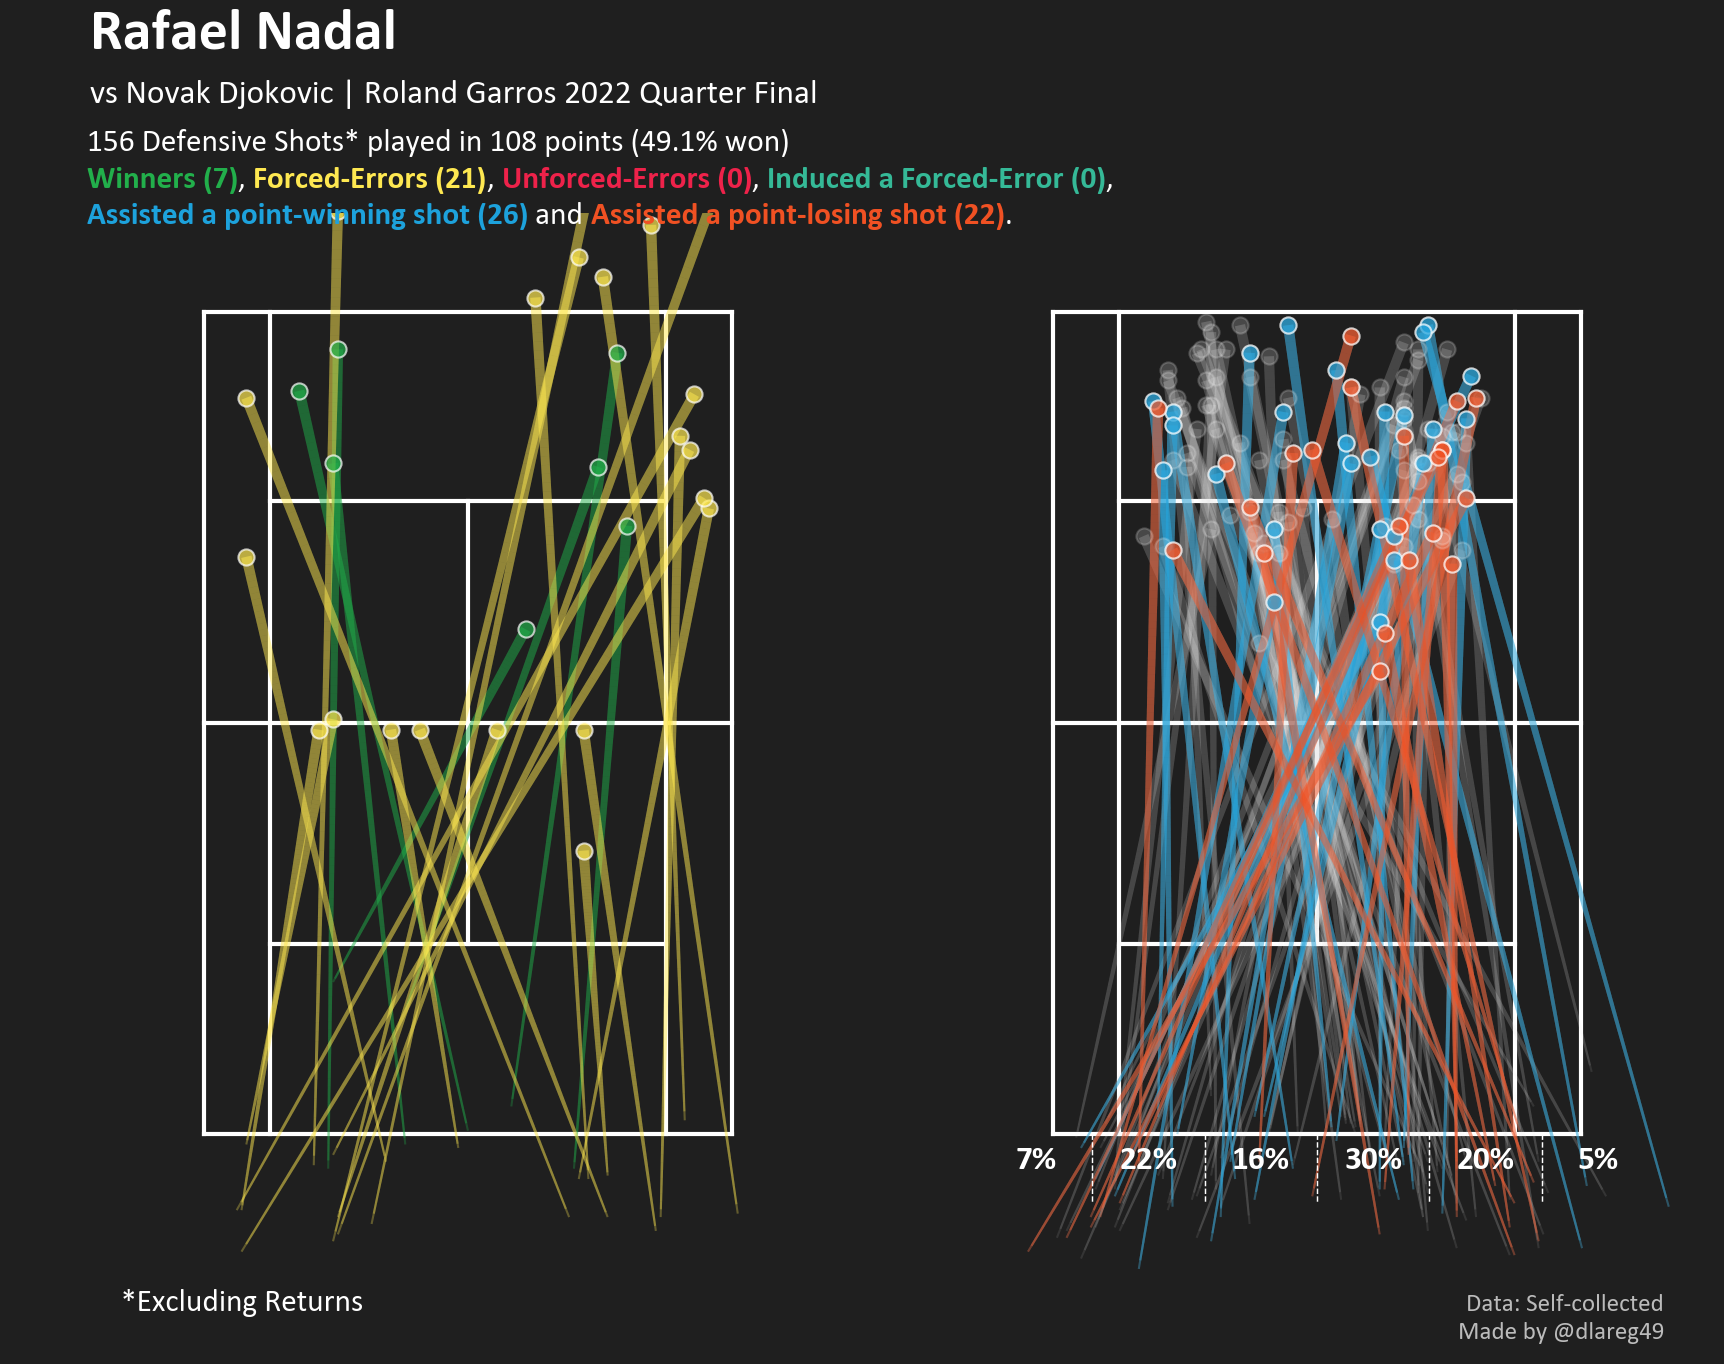
The percentages below the baseline show how often shots were hit from each demarcated contact point zone.
He was also most successful at getting depth and centrality from shots received down the middle, winning 60% of points in which these shots were played as well as 5 winners. For a little bit of sanity checking, here’s one of those winners.
From the score and what we’ve learnt so far, Djokovic obviously didn’t fare as well in this metric, rescuing himself from these only 40.3% of the time.
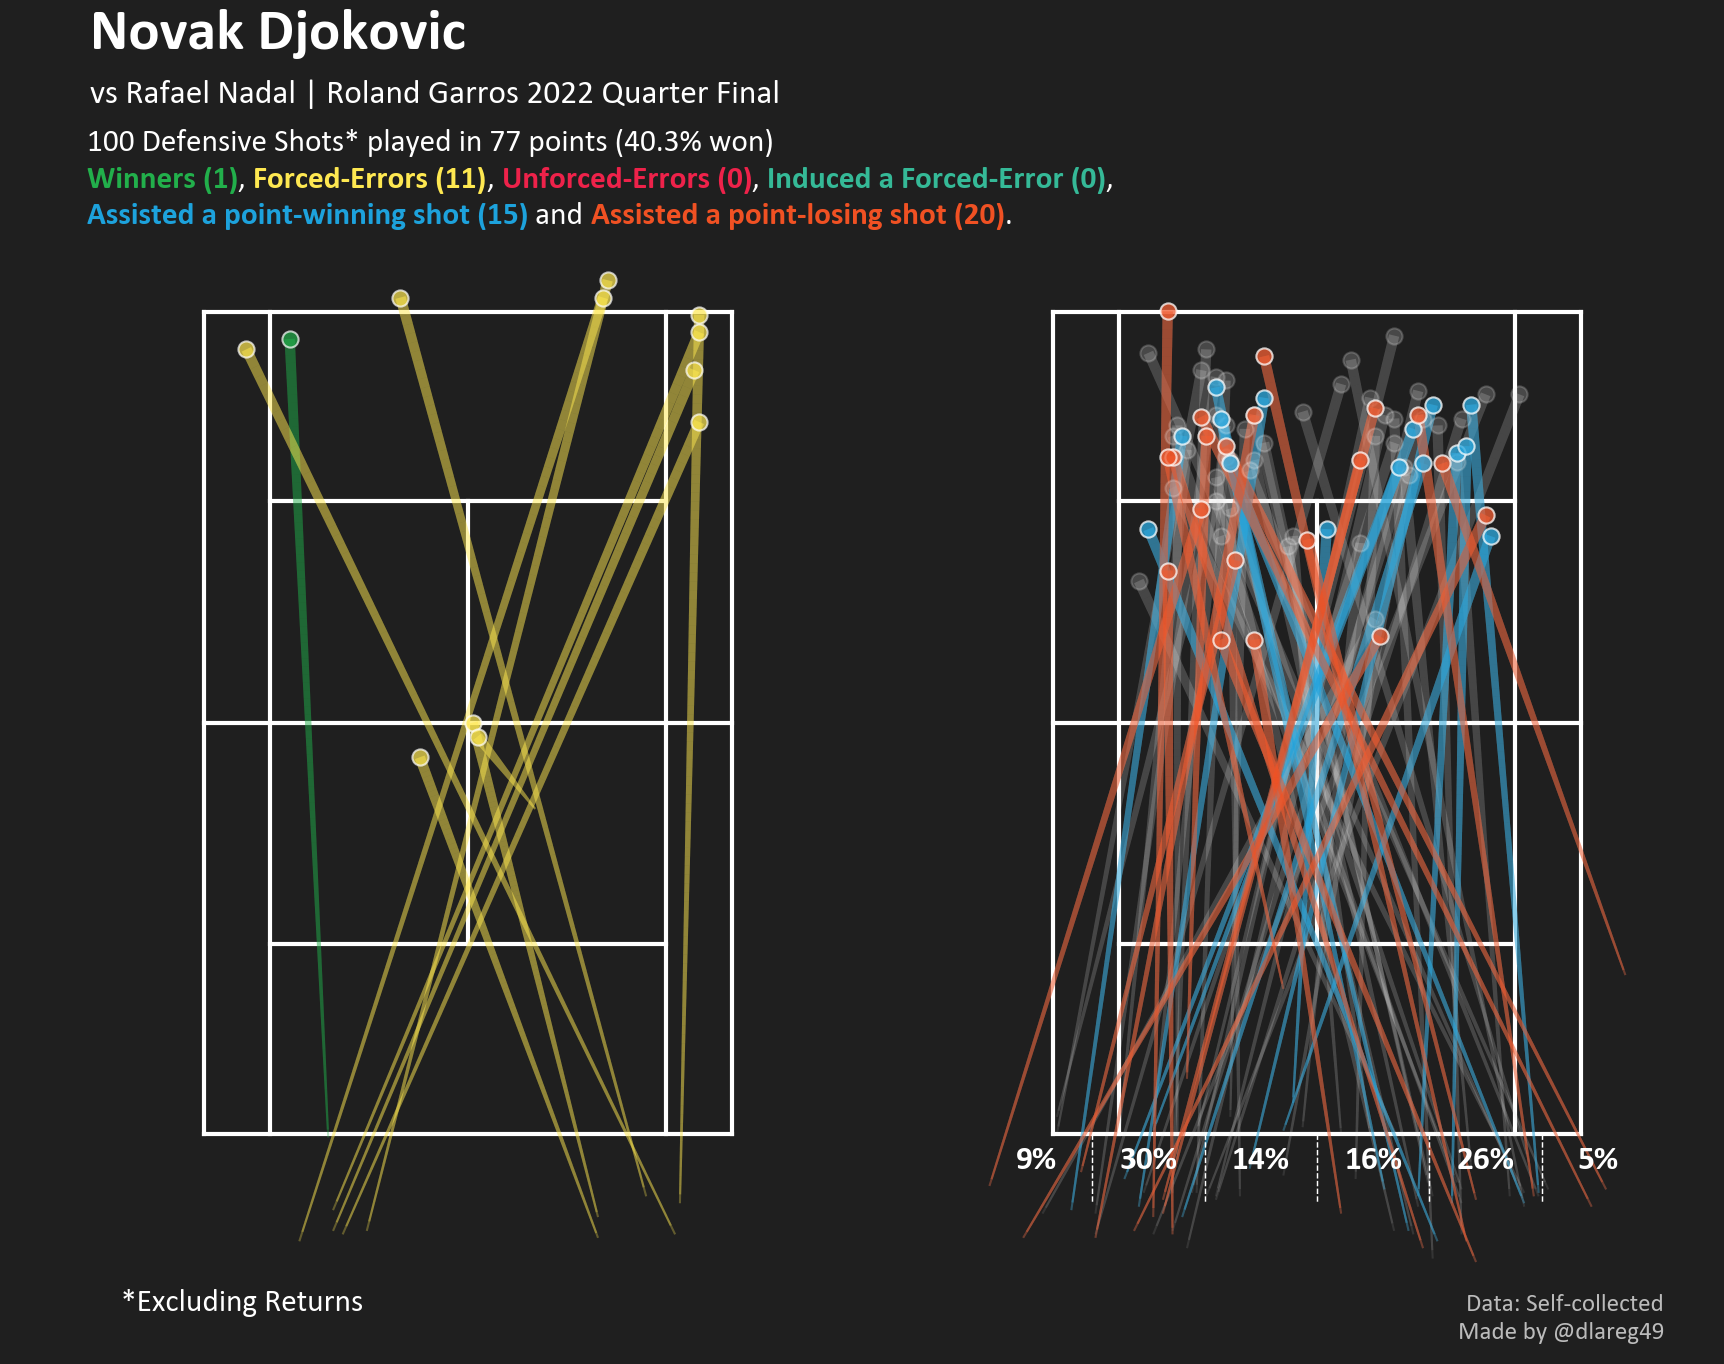
Three other characteristics can also be observed from his shot map, 1) he achieved much less depth on these shots than Nadal; 2) much fewer shots were directed back to the middle; 3) the highest amount of defensive pressure was applied by Nadal on Djokovic’s backhand side although both wings were defended relatively evenly i.e. 4 vs 5 forced errors and 10 vs 7 losing-point assists from the backhand and forehand wings respectively.
End Thoughts and Future Work
Despite the substantial amount of time spent collecting this data and producing an analytically-focused writeup, I’ve probably only scratched the surface of what can be done with this dataset. With positional data for every single shot, I’m hoping to at least experiment building a proof-of-concept expected shot value model and try applying that to a subset of the match; e.g. what can the first three sets worth of groundstrokes tell us about how much value each groundstroke in the fourth was worth? Another meticulous rewatch of the match could also enable me to add contextual or “phase of play” labels to each stroke and from there, come up with a better algorithm for phase determination or even design a proof-of-concept machine learning model for that purpose. I might also have a full crack at that RG 2021 Final dataset and explore the possibilities that the z-coordinates have to offer.
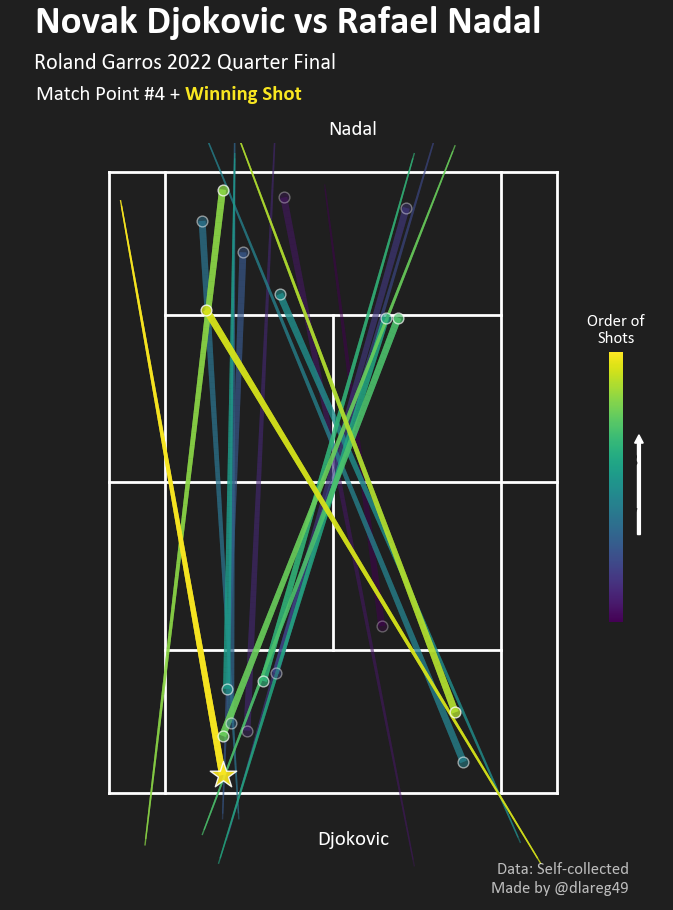
Closing off, I hope this was at least an interesting (and not too long-winded) read for you, whether you are a data enthusiast, a casual fan, a tennis nerd or a random passerby. Last but not least, I’m glad I kept to my previous post’s promise to not take another year+ before the next. With that, I leave you with one last shot map, depicting this match’s winning moment.
Appendix
Here are some other figures that were omitted from the main text.