Scatter Plots for Tennis (Break Points)
in Tennis on Tennis, Atp, Analytics
Scatter points have emerged as one of the most popular methods for visualising football data recently. While not novel by any means (though I’m not sure about the first ever documented scatter plot), displaying complementary data on 2 axes really helps to bring out striking bits of information that aren’t so discernable when analysed separately e.g. correlations or clusters of data. To cite an example, the below plot which was produced by the Financial Times towards the end of the last PL season does very well to emphasise the unprecendented levels that both Man City and Liverpool hit relative to winners and runners ups from past seasons.

Besides this, football scatter plots also began to amuse me after a while due to Messi ending up at the top right corner virtually everytime, so much that somebody felt compelled enough to create a subreddit dedicated to this occurrence. Anyway, a while ago (~2018) I was interested to see if anyone had created and shared similar visuals for the professional tennis tour. While tennis analytics has certainly been on the up as well thanks to the likes of IBM and the Match Charting Project/ Jeff Sackman, I wasn’t able to find many openly available data analysis pieces beyond the aforementioned sources. That’s what inspired this project I suppose, nearly 2 years ago, which I’ve finally “completed” and can write about now. Alright, let’s get to it then!
Data
Data was sourced from this genius website called Ultimate Tennis Statistics which is genuinely a statistic goldmine for avid tennis fans. Data can be downloaded via CSV format! I have also only analysed the Men’s Tour which I will refer from now as the ATP for convenience (note: the results presented include Grand Slam data, even though pedantically speaking Grand Slams aren’t adminstered by the ATP).
ATP Break Point Statistics
Who’s the servebot? Who can’t serve??
For this project, I was aiming to get some insight into player performance. A straightforward match statistic of a player’s ability is to simply look at his points won %. From here we can simply split this into service/ return points won % that can tell us how well a player plays in the respective scenarios. Instead of this more obvious choice of using service/return points won % to, I opted to look at break points faced/ created per service/return game instead, as I felt that these are a more direct measure of how often players face/force pressure situations, in addition to being less commonly used.
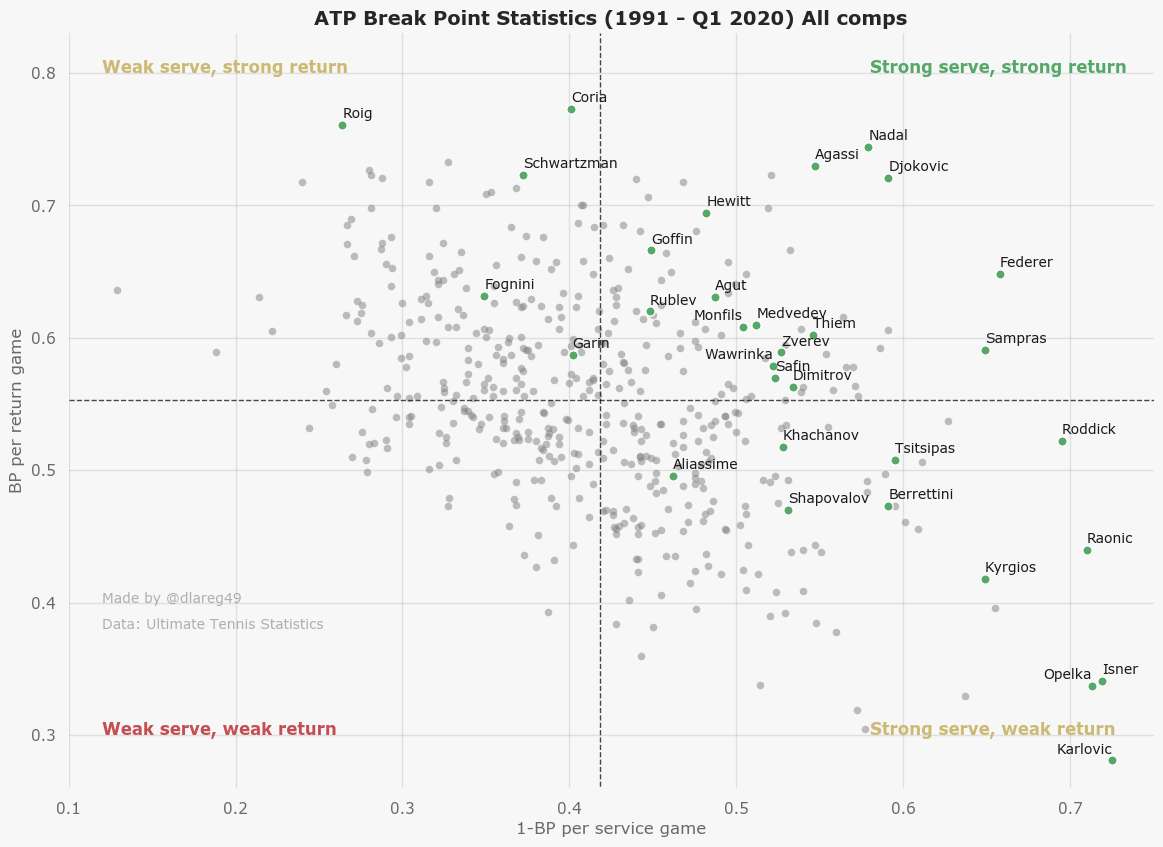 Data spanning the Men’s tour from ATP 250s up to Grand Slams and Team Competition, 1991 (the earliest year with available stats) to 2020. Annotated players include the current ATP top 20, other notable players and interesting data points. Dashed lines indicate the mean value of each metric.
Immediately we observe that most of the top players are spread in the 2 right quadrants, no surprise that Federer, Nadal, Djokovic, Sampras and Agassi lead the way at the top right by quite a decent margin too. While no player highlighted here finds himself in the bottom left, a number do appear in this so-called “servebot” territory where to the surprise of absolutely no one, we find the likes of Dr Ivo and John Isner. Some surprising finds, 1) Kyrgios’ all round game must be vastly overrated by the tennis community/media given that he’s actually one of the extreme contrasting cases. Perhaps his occasional slackness/tanking during matches skews his return game stat down a fair bit? 2) Fognini being in the both weak area, as he’s more or less been top 30 for last 7 or so years. He’s even won a Masters 1000!
Taking your chances
I remember watching the 2015 US Open Final and feeling a bit sorry for Federer who lost in large part thanks to his dismal 4/23 break point conversion rate. I even recall the commentators joking that “it’s the danger zone for Roger” whenever he went 40-15 up on Djokovic’s serve. Well, karma does have a way of prevailing sometimes and Djokovic ended up with the silver plate the following year to Wawrinka with just 3/16 converted. So, is Federer really that awful at break points as some fans claim (cue the Break-erer nicknames)? Was 13/16 saved for Wawrinka business as usual or an anomaly? Let’s see what the stats say.
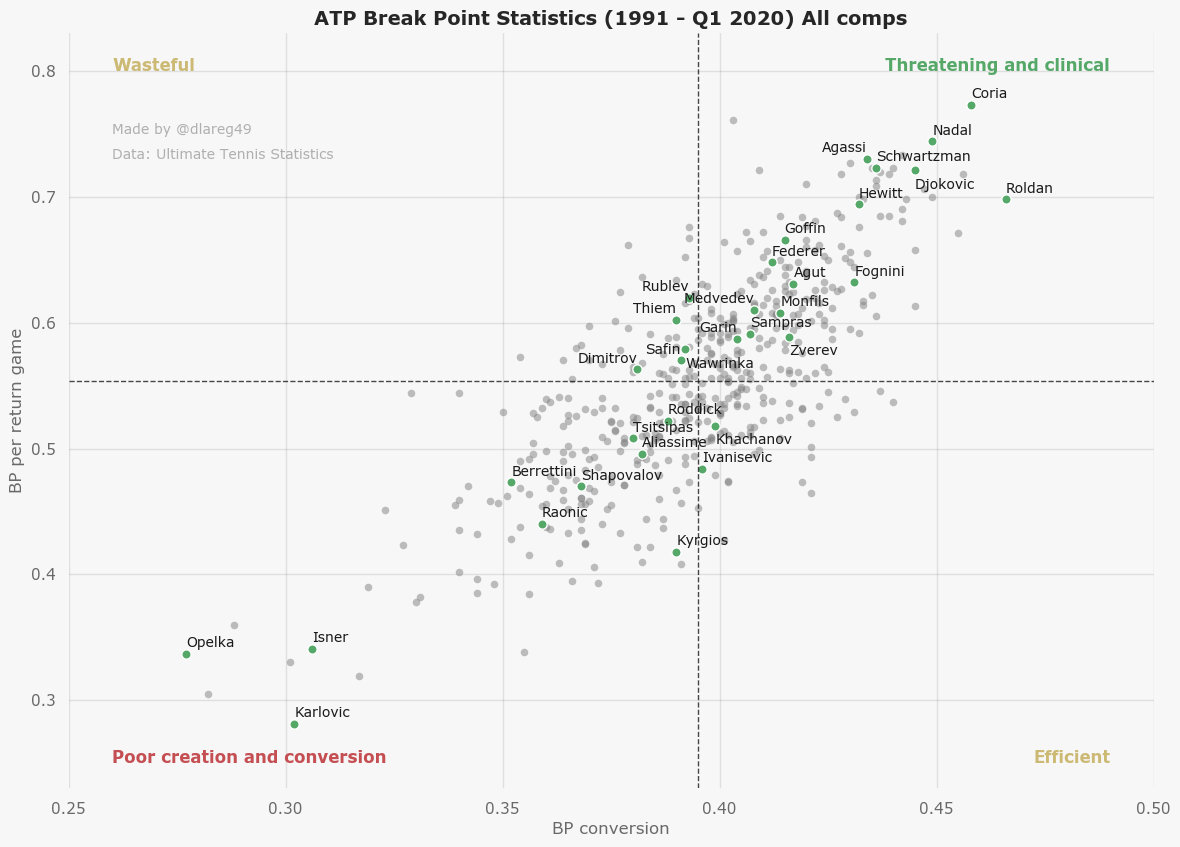 Data similarly sourced and labelled as before.
You’ll first see that these two metrics are quite positively correlated, which is to be expected. As it turns out, Djokovic is in fact one of the best break point creaters and converters (alongside Nadal), Federer isn’t “amazing” but comfortably above average and Wawrinka is actually just inside the “Wasteful” region. The top performer in this was unexpected for me, the “King of Clay” pre-Nadal days, Guillermo Coria, who’s quite fondly remembered by fans who caught the early-mid 2000s. Meanwhile, coming in first for conversion is fellow Argentine Guillermo Pérez Roldán. Considering that he peaked at number 13 in Sep 1988 (age 19), retired in 1996 and reached 15 of his 20 finals before 1991, it’s reasonable to think he should be even higher up in this stat.
Contenders and the Next Gen
Besides looking at the available historical record, I thought to look at the last 52 weeks’ worth of data which will probably weigh more favourably towards the current top 20 and younger players.
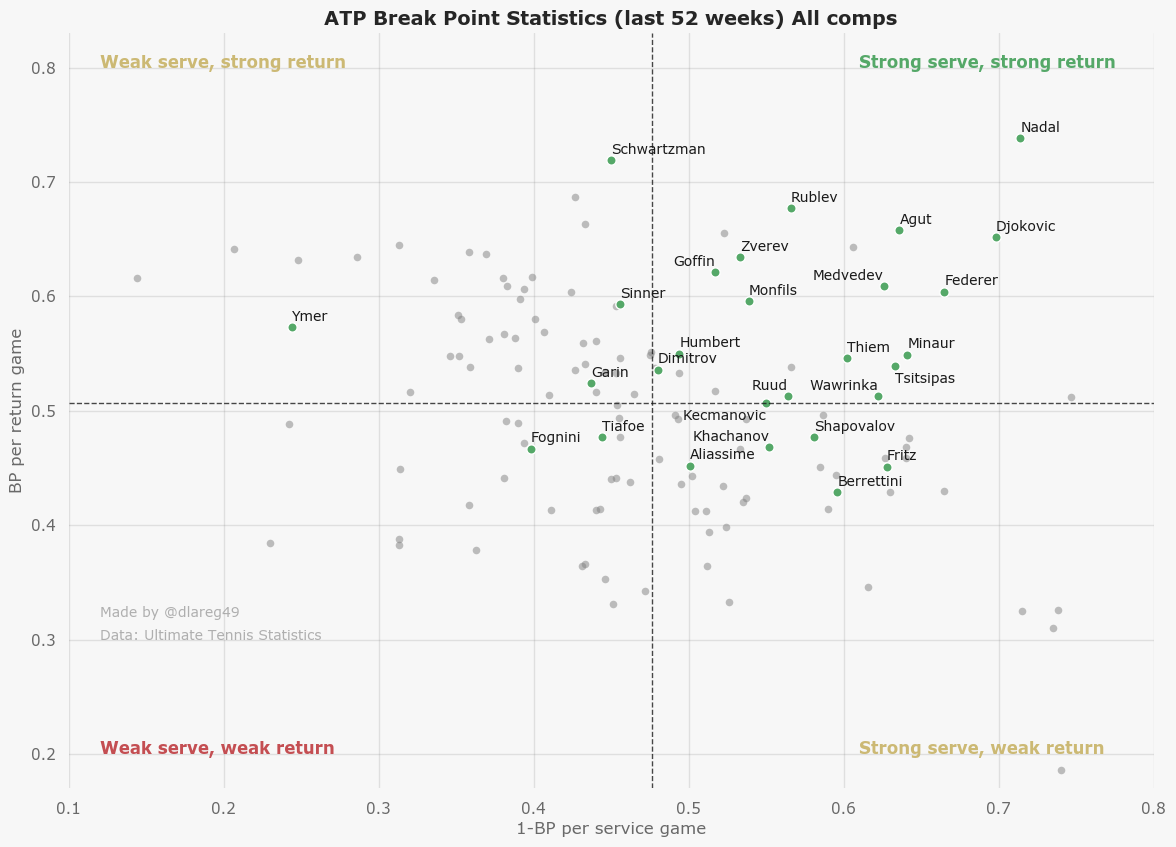
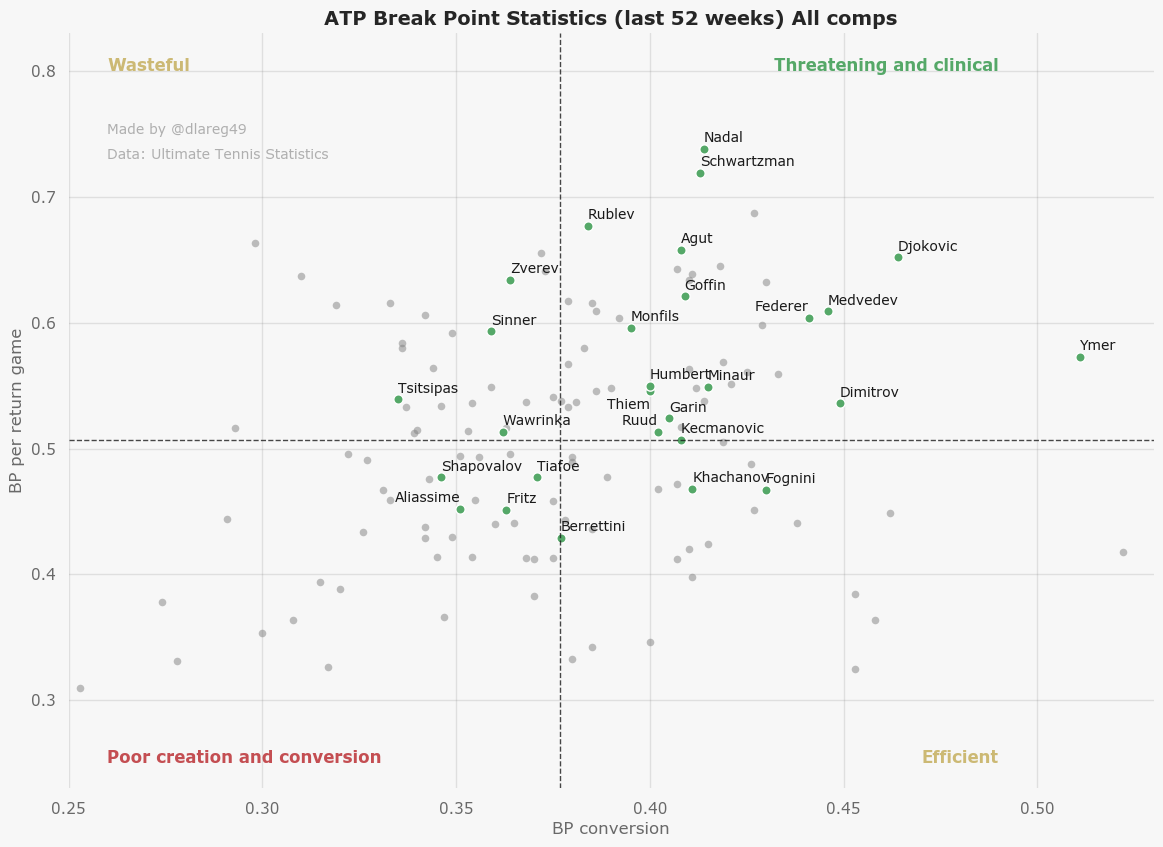 Annotated players above include the current top 20 and some recently emerging youngsters. Note that it is likely that some data points are computed from a relatively small sample of matches given the 52 week window (which unfortunately here includes the ongoing suspension due to COVID-19. E.g. Matthew Ebden has the highest break point conversion (52.17%) but calculated from just 9 matches.
It’s been over 2 years since someone not named Djokovic or Nadal won a grand slam (make it ~4 if you count Federer…man I miss Andy Murray now) but there have been encouraging signs from the contending crew with Medvedev and Thiem taking the last 2 finals to the distance. Medvedev shows up pretty respectably in these plots, although Thiem is possibly bogged down by several early exits in other tournaments. Perhaps Bautista Agut will be next in line with his relatively strong statistics and Semi-Final appearance at Wimbledon last year? Or maybe the good old undislikable La Monf? That being said, with the recent annoucements of the US Open schedule and varying players’ touring commitments, we might be in for other surprises (John Isner for US Open 2020 anyone?). As for the young up-and-comers, although I didn’t watch the Next Gen finals, these allow me to get a sense of what their rough playstyles are like. Jannik Sinner, the youngest player in the top 100 at 18, could probably work to improve his break point approach to enable his already above-average return game to bear further fruits. The 21 year old Swede Mikael Ymer, who has the 2nd best break point conversion in this dataset, should be extensively working his serve which is a shame seeing how far off the average it is.
Closing thoughts
There are a plethora of ways to analyse tennis players and I’ve really only scratched the surface with just these three dimensions. Besides looking to make some “fancy” visuals with tennis data I was probably also motivated through this, to look back on tennis history, go “oh, I didn’t expect this player to be that good/bad actually” and maybe change my impressions of certain players. Anyway, I’ll end this post with an interactive version of the 1991-2020 Break Point Statistics plot (probably best viewed on a desktop for now), which also allows you to highlight individual players and certain notable groups of them (e.g. former world #1s). Have fun with it and til next time :D.
