Liverpool Analytics Challenge
in Football on Football, Premier league, Analytics

A while ago I decided to have a go at the Liverpool Analytics Challenge organised by the Friends of Tracking team.
Ready for a challenge? We have been provided tracking data for 19 Liverpool goals from 2019 by @lastrowview. The #FoT competition is to do a data-driven analysis of how The Reds score. Deadline 11th May. Start today. https://t.co/aqja37cy5z— David Sumpter (@Soccermatics) April 28, 2020
The biggest novelty of the challenge was perhaps the provision of tracking data for 19 Liverpool goals provided by @lastrowview. Before this, I believe the most detailed publically available datasets were the event-level datasets provided by Statsbomb and Wyscout. There was also data provided for the PSG Sports Analytics Challenge but I haven’t checked if that data is stil hosted online.
Anyway, the goals of the challenge were to:
Use one or more of the tools taught as part of the Friends of Tracking series (pitch control, speed and acceleration, passing networks, pass maps etc.) to analyse the data.
If you wish, combine your analysis with other data available from other sources on Liverpool.
Produce an output (short report/video) that can be commicated either to a coach, a video analyst or players.
I had pretty much one weekend to produce something before the deadline so yep I was pretty much glued to my monitor for that whole weekend. The rush of producing a deliverable did bring back some memories of previous all-nighter and deadline cramping experiences at hackathons, but thankfully not too much sleep was sacrificed this time.
The most substantial tool taught by Friends of Tracking at that point was probably the Pitch Control model, conceptualised by William Spearman (now chief data scientist at Liverpool) et al at Hudl as a model for ball control in football based on how long it takes a player to reach the ball (time-to-control) and how long it takes a player to control the ball (time-to-control).
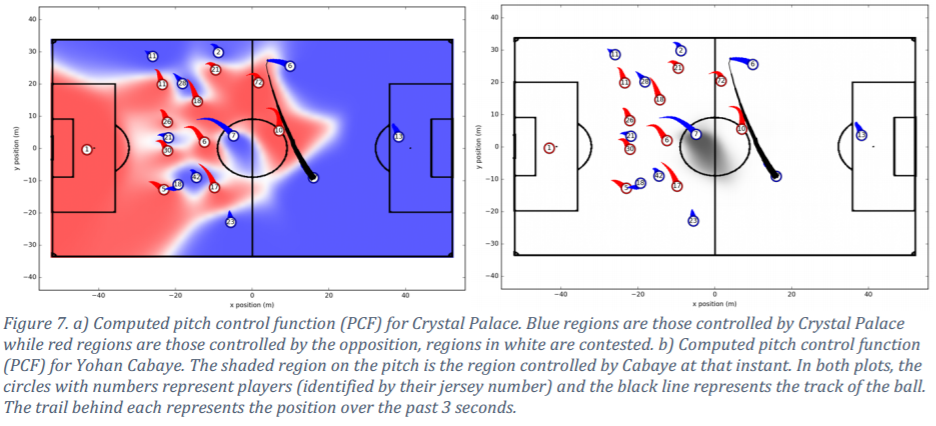 Source: Physics-Based Modeling of Pass Probabilities in Soccer, Spearman et al., 2017
Whilst I was working on the initial parts of my project, I had come across many neat animations and analyses of pitch control by other twitter users taking part in the challenge. I decided to take a slightly different approach for my submission by seeing if static visuals of pitch control change (gain) can still tell a good amount of information about a sequence of play (goals scored in these instances). For each sequence of events, I computed the pitch control values per 10 frames and simply took the linear regression gradient at each grid point. An example of the end result using Salah’s goal against Man City this season is shown below.
Salah’s header to make it 2-0 back in November. The successful long diagonal spearheads a surge in Liverpool’s pitch control into right midfield. By the time of Salah’s shot, Liverpool have made gains all across City’s box thanks to the runs of Liverpool’s 3 forwards. #FoT pic.twitter.com/3AZlBxSRzg— Gerald L (@dlareg49) May 10, 2020
Using this method, I then compiled the same plots for the other goals in the dataset (the PC function failed to converge for 3 goals, didn’t manage to investigate why), thinking that from this collection of pitch control gain plots we can maybe identify certain characteristic “fingerprints” of how Liverpool score their goals.
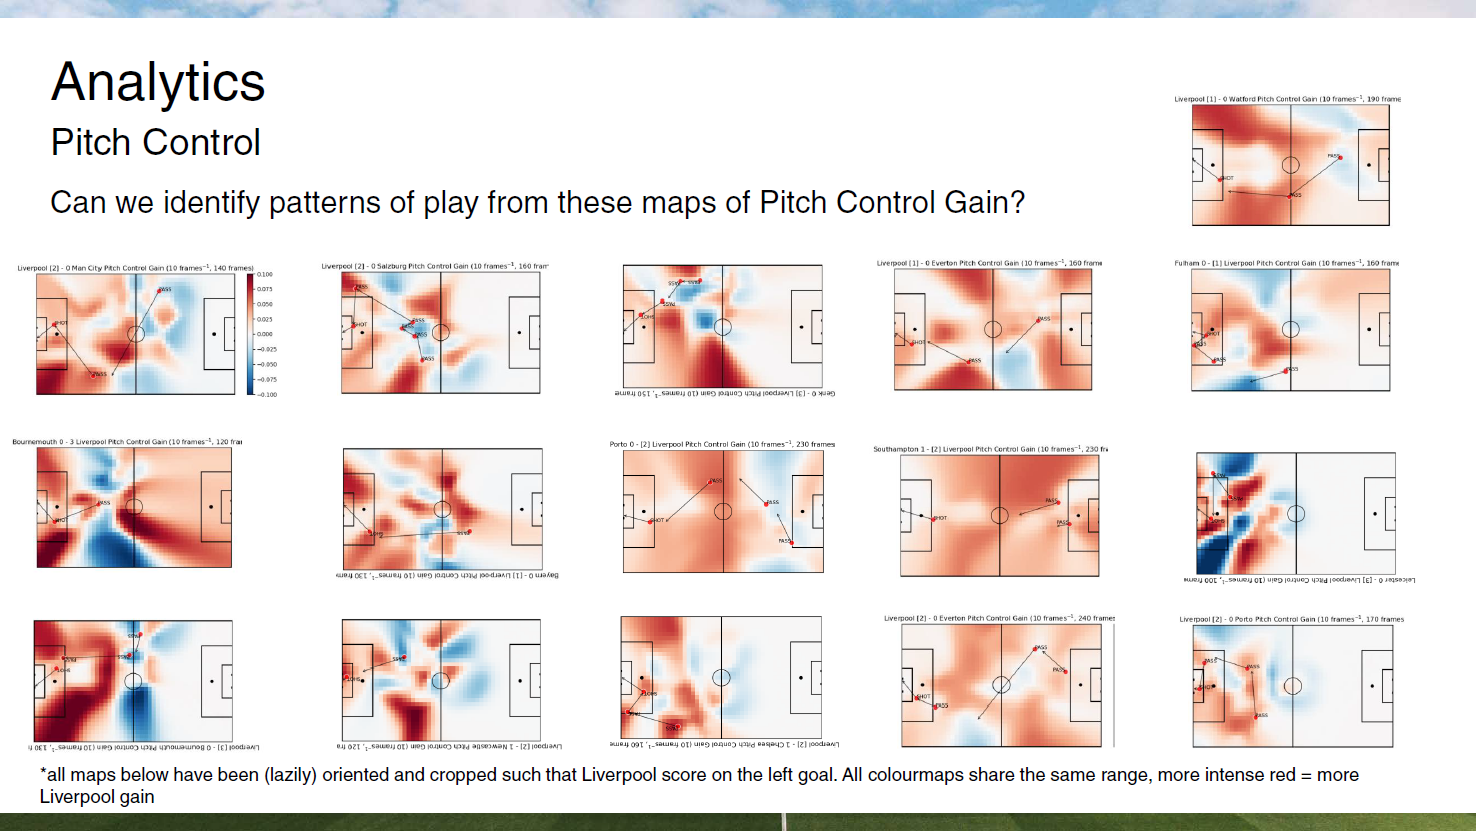
While the size of the dataset is too small for me to robustly infer anything, I think the main impression that I got was that Liverpool tend to gain the most control relatively evenly down the flanks during their successful attacking sequences.
All in all, while I didn’t manage to come up with something truly novel for this competition, this was definitely a fun and fruitful exercise and I’m thankful to Friends of Tracking, Last Row and Metrica Sports for giving me and other budding enthusiasts the opportunity and resources to mess around with some highly coveted football tracking data. I wished to keep this post short but I think it’s gone on longer than I anticipated initially already, so I’ll just leave my submitted presentation (which I modelled after an opposition “primer” of sorts) below for your viewing. Til next time ;)